Deskripsi
Rolling Z-Score Trend Heat — Lihat Suhu Pasar secara Real Time
✅ 9 mode panas cerdas — dari sinyal mentah hingga kekuatan yang dikonfirmasi MTF ✅ Garis MA HeatFlow PRO dengan efek cahaya, kabut, pita, dan pulsa ✅ Konfirmasi Z-Score multi-timeframe dengan validasi kemiringan ✅ Deteksi rezim volatilitas + filter chop ADX bawaan ✅ Panah masuk/keluar dengan filter arah MA untuk sinyal yang bersih dan selaras
Ini bukan osilator momentum yang Anda lihat di subwindow. Rolling Z-Score Trend Heat melukis kekuatan statistik pasar langsung ke grafik Anda — sebagai warna, sebagai panas, sebagai garis MA yang bersinar yang memberi tahu Anda persis apa yang sedang dilakukan tren saat ini.
Mengapa Z-Score — dan mengapa ini bekerja
Sebagian besar indikator bereaksi terhadap harga. Yang ini mengukur seberapa jauh harga telah bergerak relatif terhadap sejarah terbarunya sendiri, dinormalisasi oleh volatilitas. Itu berarti sinyal menyesuaikan secara otomatis — tanpa perlu kalibrasi ulang untuk sesi, simbol, atau kerangka waktu yang berbeda.
9 mode panas — satu alat, setiap kondisi pasar
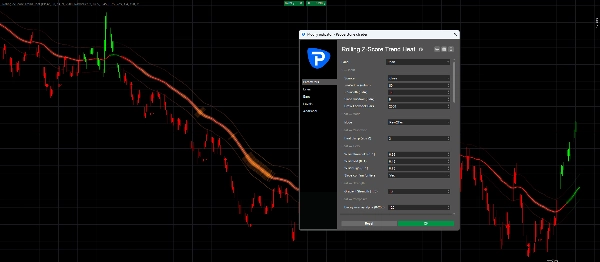
Dari Raw Sign dua warna yang bersih hingga overlay Composite Strength + Decay penuh, Anda memilih seberapa agresif panas merespons harga. Mode Chop Filter meredupkan sinyal selama pasar yang bergerak mendatar menggunakan mesin ADX bawaan. Mode MTF Confirm hanya menunjukkan panas penuh saat kerangka waktu yang lebih tinggi setuju. Anda menyesuaikan indikator dengan sesi Anda — bukan sebaliknya.
Garis MA HeatFlow — kejernihan visual tingkat profesional
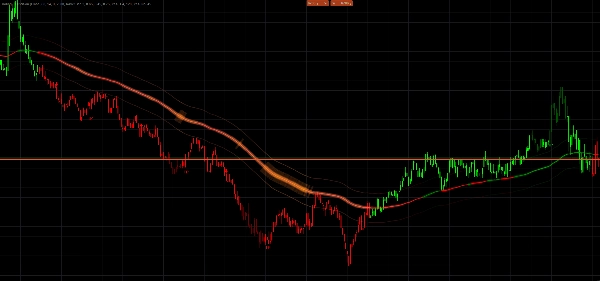
Pusat dari indikator ini adalah garis MA gradasi yang berubah warna berdasarkan arah tren dan kekuatan momentum. Tren lemah? Warna dasar lembut. Momentum membangun? Garis menjadi lebih cerah, cahaya meluas, dan kabut panas muncul di sekitarnya. Arah berbalik? Ledakan pulsa menandai momen tepatnya. Ini adalah mesin yang sama yang digunakan dalam indikator MA HeatFlow PRO — sepenuhnya terintegrasi di sini.
Sinyal yang benar-benar menyaring
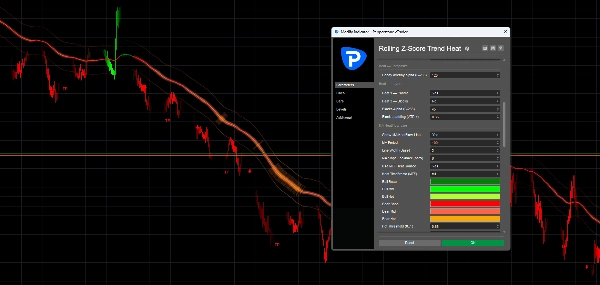
Panah masuk dan keluar didorong oleh persilangan Z-Score dengan konfirmasi kemiringan — jadi Anda tidak mengejar noise. Aktifkan filter arah MA dan panah hanya muncul saat garis HeatFlow setuju dengan arah sinyal. Panah pembalikan tren menandai perubahan rezim saat Z-Score dan kemiringan selaras. Label TP muncul secara otomatis saat kondisi keluar terpenuhi.
Dibuat untuk grafik tick dan M1 — disetel untuk kecepatan
Pengaturan default dioptimalkan untuk M1 dan Tick30–Tick100. Sistem batas lookback menjaga objek grafik tetap bersih dan kinerja stabil bahkan pada data tick yang padat.
Jika Anda menginginkan grafik yang menunjukkan kekuatan tren, keadaan momentum, dan waktu sinyal dalam satu pandangan — ini adalah alatnya.
Ringkasan
A key feature is the MA HeatFlow line, a gradient moving average that changes color and visual effects to represent trend direction and momentum intensity, including glow, fog, and pulse effects for clear trend state visualization. Entry and exit signals are generated from Z-Score crossovers with slope validation and can be filtered by the MA HeatFlow line direction to improve signal alignment. The tool is optimized for fast timeframes such as M1 and tick charts, maintaining performance with a lookback cap system. It supports various markets including indices, commodities, forex pairs, cryptocurrencies, and stocks. This indicator integrates trend strength, momentum, and timing signals into a single, visually intuitive chart overlay.


