AccountType Sample
Indikator
88 unduhan
Versi 1.0, Jan 2025
Windows, Mac
3.0
Ulasan: 1
Deskripsi
sdcfd
Ringkasan
Ringkasan AI
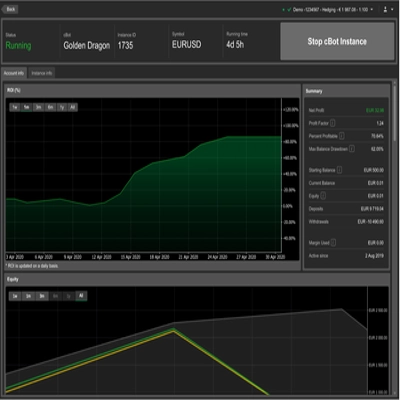
AccountType Sample is an indicator product designed for trading platforms. The available description and short summary provide minimal information, with no specific details on functionality, supported markets, or features. The product is categorized as an indicator and is associated with a single main item. No additional data on trading style, timeframe, risk parameters, or supported symbols is provided.
Profil indikator
Ulasan pelanggan
3.0
Ulasan: 1
5 | 0 % | |
4 | 0 % | |
3 | 100 % | |
2 | 0 % | |
1 | 0 % |
Ulasan pelanggan
December 1, 2025
AccountType Sample is a small educational indicator showing how to read account info (type, balance, equity) via cTrader API. Not a trading tool, but a clean and useful reference for developers. Lightweight, stable, and ideal as a starting template.
Diskusi
Pertanyaan umum
Produk-produk yang tersedia melalui cTrader Store, termasuk bot trading, indikator, dan plugin, disediakan oleh pengembang pihak ketiga serta hanya ditujukan untuk akses teknis dan informasi. cTrader Store bukan broker dan tidak menyediakan saran investasi, rekomendasi pribadi, atau jaminan apa pun tentang kinerja di masa mendatang.


Harga
Sejak 21/01/2025
88
Instal gratis