present
Sign up and get $50 off your first purchase
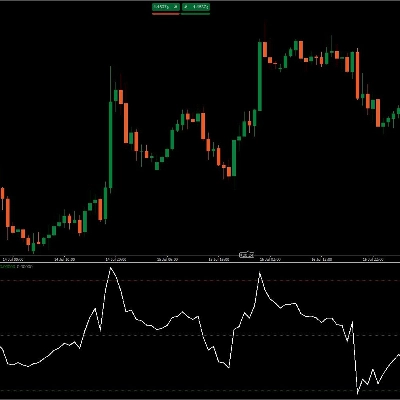
Trading product for Htfbiaspanel Indicator BTCUSD Forex, image 1
Htfbiaspanel
Indicator
Version 1.0, Apr 2026
Windows, Mac
4.6
Reviews: 6
Trading product for Htfbiaspanel Indicator BTCUSD Forex, image 2
Trading product for Htfbiaspanel Indicator BTCUSD Forex, image 3
Trading product for Htfbiaspanel Indicator BTCUSD Forex, image 4

Description

━━━━━━━━━━━━━━━━━━━━━━━━━━━━━━━━━━━━━━━━

HTF Bias Panel β€” Bias

━━━━━━━━━━━━━━━━━━━━━━━━━━━━━━━━━━━━━━━━


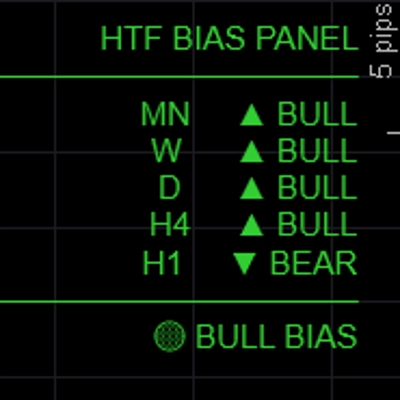
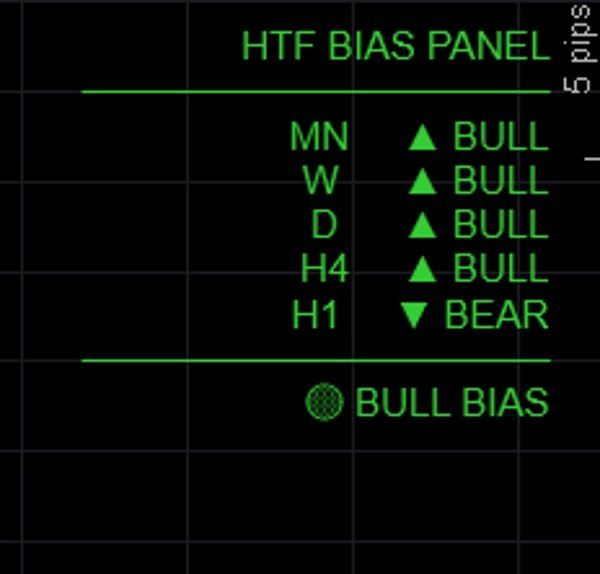
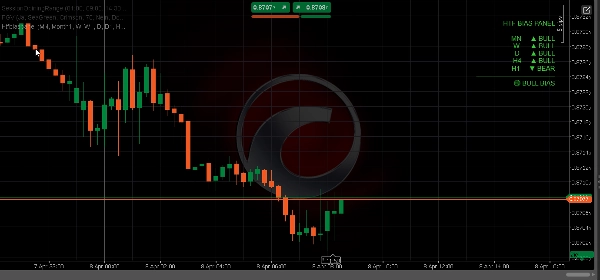
Shows the directional bias for up to five timeframes simultaneously in a clean on-chart panel β€” so you always know whether the higher timeframes are bullish, bearish, or mixed before entering a trade.


─────────────────────────────

KEY FEATURES


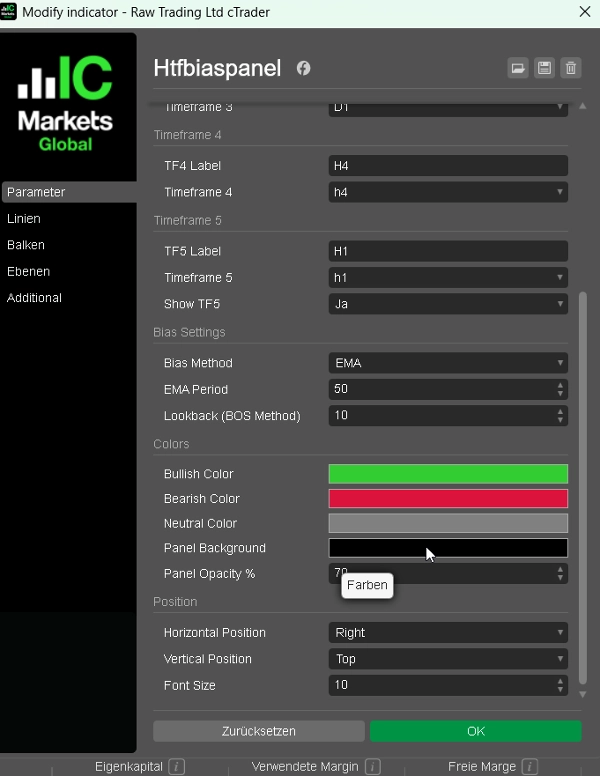
β–Ί 5 fully configurable timeframes β€” default MN / W / D / H4 / H1, all labels and TFs customizable

β–Ί Three bias methods β€” choose how bias is determined per session:

β€’ EMA: close above/below EMA(50) β†’ most reliable for trend following

β€’ Price vs Last Close: current close vs previous close β†’ reactive, momentum-based

β€’ BOS: recent range vs prior range β†’ structure-based bias

β–Ί Alignment summary β€” FULL BULL / FULL BEAR / BULL BIAS / BEAR BIAS / NEUTRAL shown at bottom of panel

β–Ί Color-coded output β€” green for bullish, red for bearish, gray for neutral

β–Ί Panel position β€” place top-left, top-right, top-center, bottom-left, or bottom-right

β–Ί Fully customizable colors for bullish, bearish, and neutral states

β–Ί Lightweight β€” no chart drawings, no rectangles, no overhead


─────────────────────────────

BIAS METHODS EXPLAINED


β†’ EMA (default): Bullish if close > EMA(period). Most stable, ignores short-term noise.

β†’ Price vs Last Close: Bullish if current bar close > previous bar close. Fast and reactive.

β†’ BOS: Compares recent N-bar range to prior N-bar range. Bullish if higher highs and higher lows.


─────────────────────────────

DEFAULT SETTINGS


β†’ TF1 Monthly (MN)

β†’ TF2 Weekly (W)

β†’ TF3 Daily (D)

β†’ TF4 H4

β†’ TF5 H1 (toggleable)

β†’ Bias Method EMA

β†’ EMA Period 50

β†’ Bull Color LimeGreen

β†’ Bear Color Crimson

β†’ Position Top Left


─────────────────────────────

HOW TO USE


1. Add the panel to any chart

2. Choose your preferred bias method (EMA recommended for beginners)

3. Check the alignment summary before entering a trade β€” only take longs when BULL BIAS or FULL BULL

4. Use HTF bias to filter signals from your BOS/CHoCH or FVG indicator β€” only trade in the direction confirmed by the panel

5. Adjust timeframes to match your trading style (e.g. D / H4 / H1 / M15 / M5 for scalpers)


─────────────────────────────

IDEAL FOR


βœ” ICT and Smart Money Concepts traders needing quick top-down analysis

βœ” Multi-timeframe traders who want a fast visual bias check

βœ” FTMO and prop firm traders who need to trade with confluence

βœ” Any trader who wants to avoid trading against the higher timeframe trend

βœ” Forex, Gold, Indices, and Crypto CFD traders


─────────────────────────────

COMPATIBILITY


β†’ Platform cTrader (Desktop & Web)

β†’ Asset classes Forex, Indices, Commodities, Crypto CFDs

β†’ Timeframes All (M1 to MN)

β†’ Access Rights None required

β†’ Account type Live & Demo


━━━━━━━━━━━━━━━━━━━━━━━━━━━━━━━━━━━━━━━━


Summary

AI summary
HTF Bias Panel is a trading indicator designed for the cTrader platform (desktop and web) that displays directional market bias across up to five configurable timeframes simultaneously. It provides a clear on-chart panel showing whether higher timeframes are bullish, bearish, or neutral, aiding traders in aligning their entries with the prevailing trend. Users can select from three bias determination methods: EMA (close relative to EMA 50), Price vs Last Close (momentum-based), and BOS (structure-based range comparison). The panel includes an alignment summary indicating overall market bias states such as FULL BULL or FULL BEAR, with color-coded signals (green for bullish, red for bearish, gray for neutral). The panel’s position and colors are fully customizable. Default timeframes range from monthly to hourly but can be adjusted to suit different trading styles, including scalping. The indicator is lightweight, with no chart drawings or overhead. It supports multiple asset classes including Forex, Indices, Commodities, and Crypto CFDs. HTF Bias Panel is suitable for traders using Smart Money Concepts, multi-timeframe analysis, or those requiring confluence with prop firm trading rules. It helps avoid trading against higher timeframe trends by providing a fast visual bias check.
Indicator profile
Indicator category
Market structure (SMC)
Output type
Visualisation
Filter
Data requirements
Bars only
Volume
Supported signals
Session opening range
Breakout
Trend strength
Reversal

Customer reviews

4.6
Reviews: 6
5
67 %
4
33 %
3
0 %
2
0 %
1
0 %
Customer reviews
April 23, 2026
pretty solid as a second look, especially in busy review sessions.
April 21, 2026
it earns a spot because it supports the idea without replacing judgment, and a 5 minute check should not become a 30 minute rabbit hole.
April 19, 2026
HTF Bias Panel is a clean and highly practical tool for multi-timeframe analysis. It quickly shows directional bias across up to five timeframes, helping traders stay aligned with the bigger picture. With multiple bias methods and a clear alignment summary, it’s an excellent filter to avoid trading against higher timeframe trends. Simple, fast, and very effective.
April 19, 2026
5 to 8 markets is a fair first sample, and the setup review feels more organized.
April 18, 2026
the signal still needs a chart check, no surprise there. A busy screen can distract.
April 11, 2026
the reason it feels usable is the setup feels less confusing, and average R should confirm the win rate.

Discussion

FAQ

BTCUSD
Forex
Indices
EURUSD
Commodities
GBPUSD
NZDUSD
Prop
Fair Value Gap
SMC
Crypto
XAUUSD
NAS100
USDJPY
Products available through cTrader Store, including trading bots, indicators and plugins, are provided by third-party developers and made available for informational and technical access purposes only. cTrader Store is not a broker and does not provide investment advice, personal recommendations or any guarantee of future performance.

More from this author

Indicator
SMC
Prop
+5
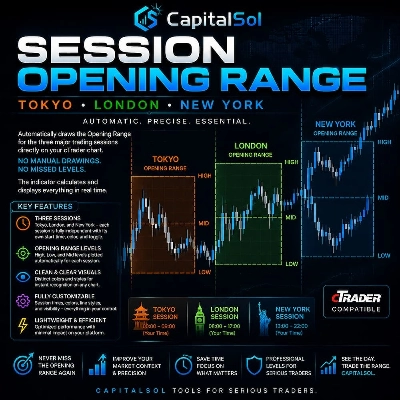
Automatically draws the Opening Range (High & Low) for Tokyo, London, and New York sessions. Configurable start times,
Indicator
Liquidity Grab
Liquidity Sweep
+2
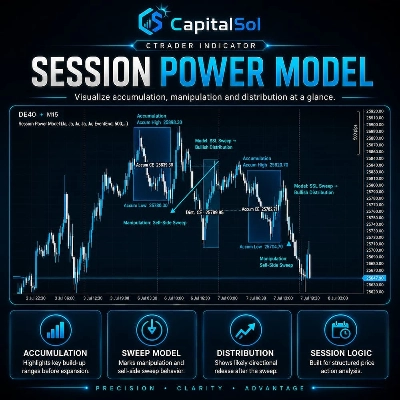
Visualizes accumulation ranges, manipulation sweeps and distribution phases on your cTrader chart.
Indicator
BOS
Key Levels
+2
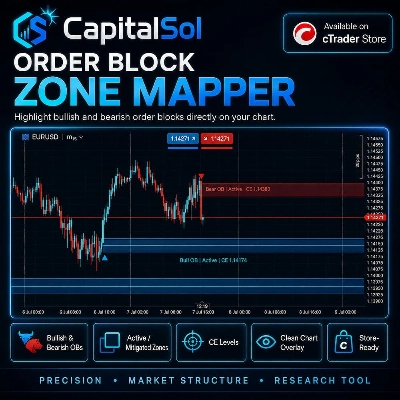
Maps bullish and bearish order block zones, CE levels and structure-based price action context.
Indicator
MSS
Key Levels
+2
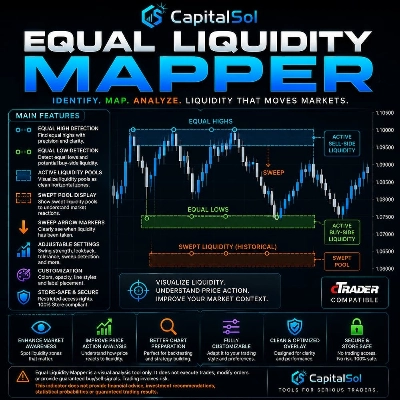
Maps equal highs, equal lows and active liquidity pools directly on your cTrader chart.
Indicator
BOS
MSS
+3
Maps BOS, CHoCH, swing breaks and market structure shifts directly on your cTrader chart.
Indicator
EMA
RSI
+2
Compact premium cTrader dashboard for market bias, sessions, premium/discount context, liquidity direction, ADR range an
cBot
ATR
EMA
+4
Professional Supply & Demand Execution Bot for cTrader. CS Apex Hunter Pro is a fully automated execution bot designed
7.6%
ROI
3.17
Profit factor
Indicator
SMC
Prop
+12
Killzone, ICT, SMC, Session, Asia, London, New York, NY PM, Session High, Session Low, Smart Money, Order Flow, Trading
Indicator
MSS
Key Levels
+4
Maps session ranges, previous highs/lows, equilibrium and premium/discount zones on your cTrader chart.

You may also like

Indicator
Forex
EURUSD
+4
Check the correlations between dozens of assets in one elegant display.
Indicator
RSI
XAUUSD
+2
Automatic ZigZag swings with dynamic support & resistance levels, labeling highs/lows for clear trend signals.
Indicator
Volume
Order Block
+4
Volume Profile with fixed period, custom range and buy/sell pressure.
Indicator
ATR
EMA
+3
The UTBot you know from TradingView Ҁ” now on cTrader with confirmed signals, VWAP, EMA and session overlays.
Indicator
Drawdown Monitor
Proprietary trading desk risk monitoring dashboard!
Indicator
Volume
Custom range volume profile between two draggable anchors. Auto source timeframe, Total/Up-Down/Delta, POC, Value Area.
Indicator
ATR
RSI
+7
Identify bullish and bearish Order Blocks to spot key support/resistance levels and potential trend reversals! πŸ“ˆπŸ”„
Indicator
Master RSI reversals with Parabolic SAR precision! Get real-time alerts for high-probability trend changes.
Indicator
Doji
Volume
+5
Instantly spot high-liquidity institutional moves with clean, non-obtrusive triangle alerts on cTrader charts.
Indicator
ADX
ATR
+1
Indicador de Sinais Visuais para Spotcrude (WTI) ou SpotBrent com filtros de tendΓͺncia, operacional de 10 e 15 minutos.
Indicator
Prop
Forex
+12
Introducing High Accuracy multi timeframe Swing high and low detector.
Indicator
MACD
Forex
+2
a revolutionary indicator that integrates volume into MACD.
Indicator
ADX
ATR
+2
GOLD SENTINEL v1.0 - A CANDLE-COLORING INDICATOR FOR GOLD.
Indicator
Forex
Crypto
+2
Market Structure Indicator – Your Trading Map in a Noisy Market. No more Panicking Which one, Where, Why and How.
"UT Bot" logo
Popular
4.4
(5)
$19
/
$20
Indicator
ATR
Forex
+11
Trend-following indicator with dynamic ATR-based trailing stop for precise entry/exit signals
Indicator
ATR
Forex
+3
LevelMaster S/R: Pinpoint key support & resistance zones with precision. Perfect for traders of all levels Trade smarter
Indicator
Forex
GBPUSD
+5
Visual warning zones for high-impact news so you can manage risk before volatility hits.
Indicator
RSI
Stochastic
+2
Composite mean-reversion oscillator merging Z-Score, RSI & Bollinger %B into one clear overbought/oversold signal.

Price

4
Sales