Deskripsi
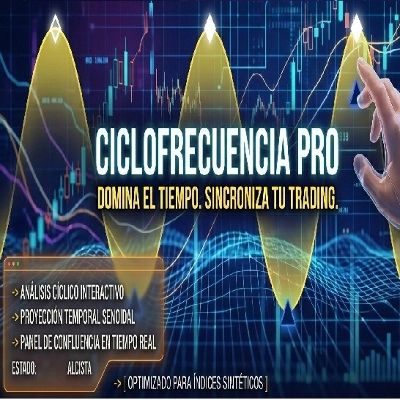
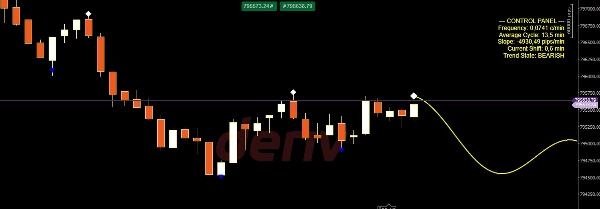
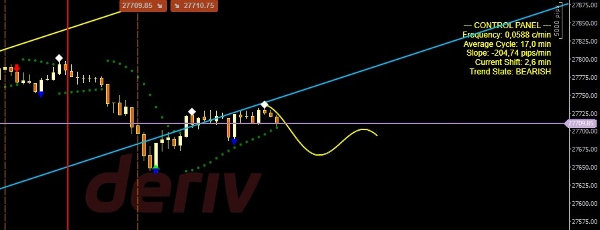
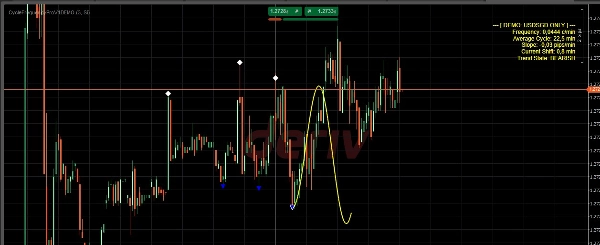
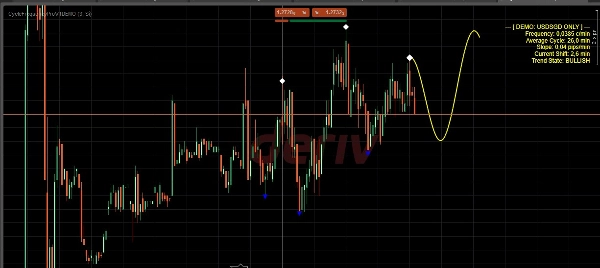
Sinkronkan Perdagangan Anda dengan Frekuensi Pasar Bosan dengan indikator yang terlambat? Kebanyakan trader gagal karena mengabaikan dimensi temporal pasar. Cycle Frequency Pro V1 mengubah permainan, memungkinkan Anda memproyeksikan aksi harga masa depan berdasarkan siklus historis dan analisis frekuensi waktu nyata.
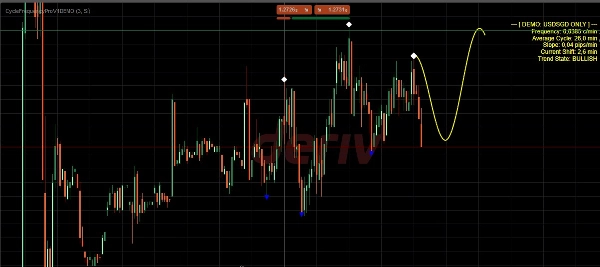
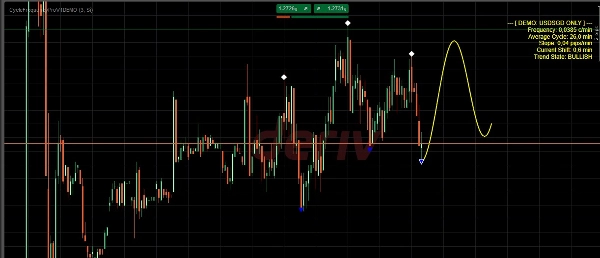
Apa yang membuat indikator ini unik? Sementara algoritma otomatis sering gagal saat volatilitas, Cycle Frequency Pro memberi Anda kendali. Dengan mengidentifikasi secara manual puncak dan lembah struktural utama, Anda memberikan "keunggulan manusia" yang diubah indikator menjadi model matematis yang tepat. Ini langsung menghitung frekuensi, kemiringan, dan pergeseran fase untuk memvisualisasikan gelombang probabilitas tinggi berikutnya.
Fitur Utama:
- Proyeksi Gelombang Sinus Dinamis: Visualisasikan lintasan harga yang paling mungkin sepanjang sumbu waktu.
- Panel Kontrol Profesional: Data waktu nyata termasuk Frekuensi (c/menit), Siklus Rata-rata, dan Kemiringan Pip.
- Mesin Geometris Presisi: Dioptimalkan untuk rendering ultra-halusan dan akurasi titik puncak.
- Fleksibilitas Lintas Pasar: Dirancang khusus untuk kelancaran 24/7 Indeks Sintetis, sambil mempertahankan performa puncak di Forex, Komoditas, dan Logam.
Mulai Cepat:
- Selaraskan berlian (puncak) dan segitiga (lembah) dengan titik balik struktural terbaru.
- Gelombang secara otomatis menyinkronkan dengan kemiringan dan ritme harga.
- Lakukan perdagangan di mana gelombang yang diproyeksikan selaras dengan zona institusional Anda.
Ringkasan
Key features include a dynamic sine wave visualization aligned with the time axis, a professional control panel displaying real-time metrics such as frequency (cycles per minute), average cycle length, and pip slope, and a precision geometric engine optimized for smooth rendering and accurate vertex placement. The indicator is engineered for versatility across multiple markets, including Synthetic Indices with 24/7 trading, Forex, Commodities, and Metals.
To use, traders align the indicator’s markers with recent structural turning points, allowing the wave to synchronize automatically with current price rhythm. This projection can then be used to identify high-probability trade entries in conjunction with institutional zones. The indicator supports visualization, signal generation for reversals, level touches, trend strength, and divergence, and requires bar or tick data for analysis. It is categorized under market structure indicators.
Ulasan pelanggan
5 | 100 % | |
4 | 0 % | |
3 | 0 % | |
2 | 0 % | |
1 | 0 % |