Deskripsi
Indikator delta kumulatif dan ketidakseimbangan yang kuat.
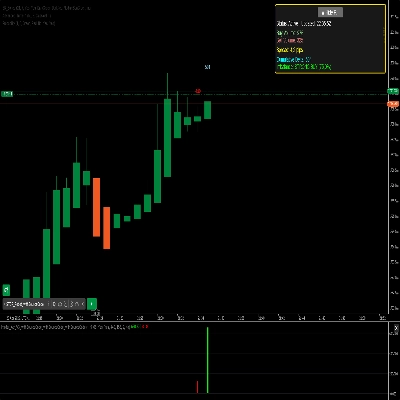
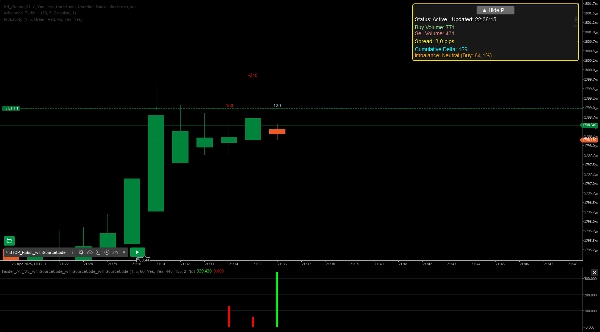
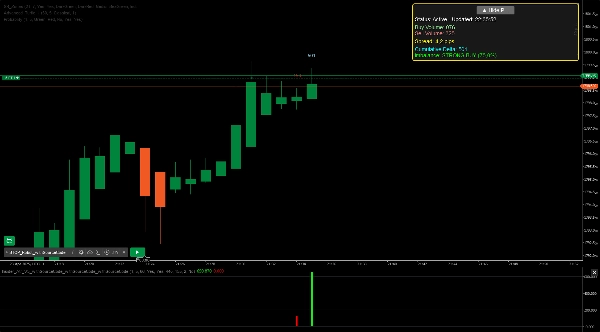
Insider adalah indikator cTrader yang kuat yang dirancang untuk menganalisis data kedalaman pasar dan menyoroti ketidakseimbangan beli dan jual secara real time. Ini memberikan umpan balik visual yang jelas pada grafik, menampilkan metrik utama seperti volume beli/jual, delta kumulatif, dan kekuatan ketidakseimbangan melalui histogram dan dasbor yang dapat disesuaikan. Sesuaikan dengan gaya trading Anda dengan pengaturan yang dapat diubah, termasuk periode tampilan, level kedalaman (1-10), dan ambang ketidakseimbangan volume (50-95%). Fitur tambahan termasuk peringatan opsional untuk ketidakseimbangan kuat, penyaringan jam perdagangan, dan panel yang dapat diubah ukurannya untuk meningkatkan kegunaan. Ideal untuk trader harian dan trader swing, indikator ini menawarkan wawasan berharga tentang sentimen pasar dan potensi pergerakan harga.
Ringkasan
Ulasan pelanggan
5 | 100 % | |
4 | 0 % | |
3 | 0 % | |
2 | 0 % | |
1 | 0 % |