
Descrizione
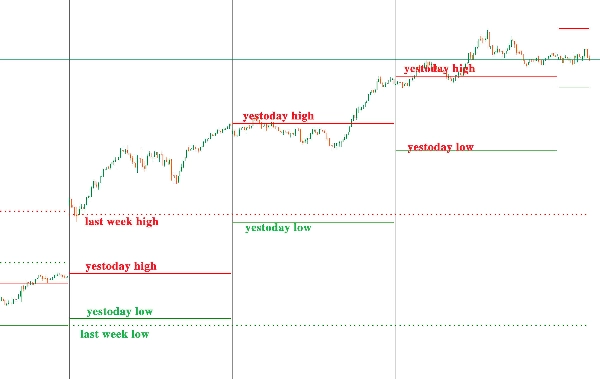
L'indicatore "Daily Levels" viene utilizzato per visualizzare il massimo/minimo della settimana scorsa e il massimo/minimo di ieri su diversi intervalli di tempo.
Massimo/minimo della settimana scorsa: contrassegnato con linee tratteggiate spesse;
Massimo/minimo di ieri: contrassegnato con linee continue sottili.
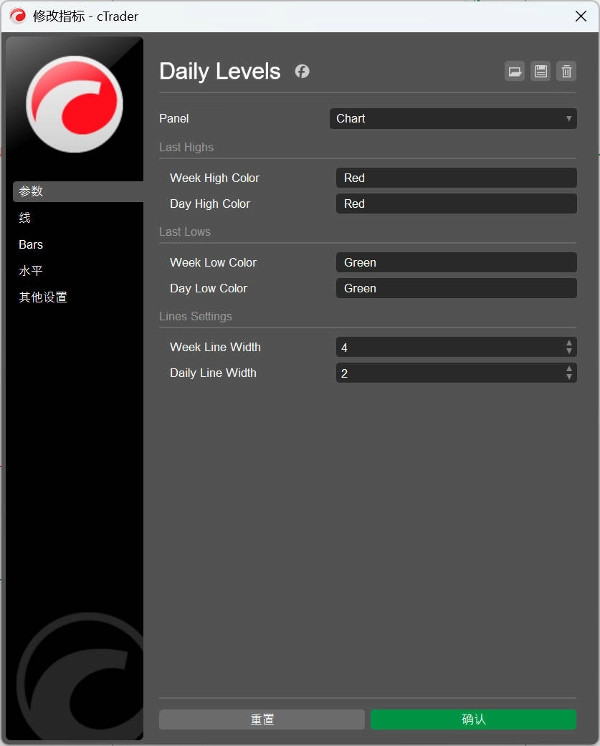
Gli utenti possono personalizzare i colori e lo spessore delle linee.
“Daily Levels”指标用于在不同的时框框架下显示上周最高价/最低价和昨天最高价/最低价。
上周最高/最低价:使用粗虚线标注;
昨天最高/最低价:使用细实线标注。
用户可以自定义颜色和线条粗细。
Riepilogo
Profilo indicatore
Recensioni dei clienti
0.0
Recensioni: 0
Recensioni dei clienti
Questo prodotto non ha ancora ricevuto recensioni. L'hai già provato? Fallo sapere agli altri per primo!
Discussioni
Domande frequenti
Forex
Signal
Breakout
Indices
Commodities
Crypto
I prodotti disponibili tramite cTrader Store, inclusi bot di trading, indicatori e plugin, sono forniti da sviluppatori terzi e resi disponibili esclusivamente a scopo informativo e di accesso tecnico. cTrader Store non è un broker e non fornisce consulenze in materia di investimento, raccomandazioni individualizzate o garanzie di risultati futuri.


![Logo di "[Stellar Strategies] Market Session Ultimate"](https://cdn.ctrader.com/image/webp/61ffd537-0125-4246-9e72-42eca1791d64_28232)


Prezzo
Da 30/09/2024
44
Vendite