

Descrizione
GIORNATA DI PROVA DEL SUPER TREND OSCILLATOR 15
"ATTENZIONE," NELLE VERSIONI A PAGAMENTO È DISPONIBILE ANCHE UNA VERSIONE DI PROVA GRATUITA DI 15 GIORNI" clicca sul prodotto a pagamento e troverai la versione gratuita-
Oscillatore SuperTrend Semplificato - Descrizione Completa
Panoramica
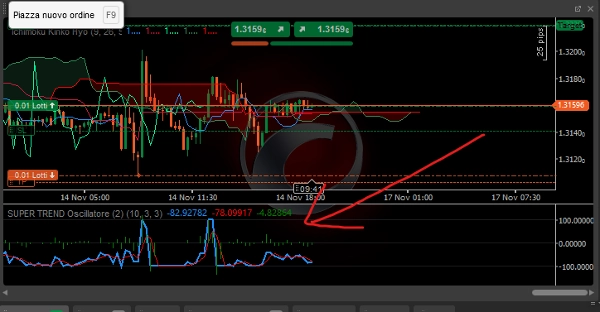
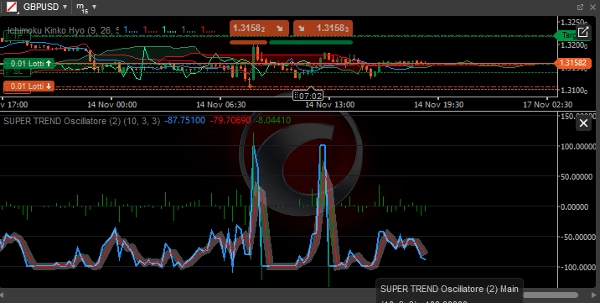
Il Oscillatore SuperTrend Semplificato è un indicatore tecnico avanzato per cTrader che trasforma il classico SuperTrend in un oscillatore visivo, rendendo facile identificare la direzione, la forza e l'affidabilità del trend.
Componenti Principali
1. Linea Principale (Blu)
- Funzione: Mostra la distanza normalizzata tra il prezzo e la linea SuperTrend
- Calcolo:
((Price - SuperTrend) / (ATR × Multiplier)) × 100 - Interpretazione:
-
- > 0: Trend rialzista (prezzo sopra SuperTrend)
- < 0: Trend ribassista (prezzo sotto SuperTrend)
- Intervallo: Da -100 a +100
2. Linea Segnale (Rossa)
- Funzione: Media mobile semplice della linea principale
- Periodo: Personalizzabile (default 3 periodi)
- Uso: Filtra il rumore di mercato e conferma i segnali
3. Istogramma (Grigio)
- Funzione: Differenza tra linea principale e linea segnale
- Interpretazione:
-
- Positivo: Accelerazione del momentum rialzista
- Negativo: Accelerazione del momentum ribassista
- Incrocio dello zero: Potenziali inversioni di momentum
Parametri Configurabili
Parametri SuperTrend:
- Periodo ATR: Periodo per il calcolo dell'Average True Range (default: 10)
- Moltiplicatore: Moltiplicatore per le bande SuperTrend (default: 3.0)
Parametri Oscillatore:
- Periodo Segnale: Periodo per la linea segnale (default: 3)
Interpretazione del Segnale
Condizioni di Trend:
- Forte Trend Rialzista:
-
- Principale > +50
- Principale > Segnale
- Istogramma positivo
- Forte Trend Ribassista:
-
- Principale < -50
- Principale < Segnale
- Istogramma negativo
- Mercato Laterale:
-
- Principale tra -30 e +30
- Frequenti incroci di linea
Segnali di Trading:
Entrata Long:
- La linea principale attraversa sopra 0
- L'istogramma diventa positivo
- La linea segnale conferma il rialzo
- Principale sopra +20 per il momentum
Entrata Short:
- La linea principale attraversa sotto 0
- L'istogramma diventa negativo
- La linea segnale conferma il ribasso
- Principale sotto -20 per il momentum
Uscita/Take Profit:
- Long: Principale > +80 (ipercomprato) o incrocio sotto la linea segnale
- Short: Principale < -80 (ipervenduto) o incrocio sopra la linea segnale
Vantaggi della Versione Semplificata
1. Prestazioni Ottimizzate
- Calcoli più efficienti
- Minore consumo di risorse
- Risposta più rapida ai cambiamenti di prezzo
2. Facilità d'Uso
- Parametri essenziali ridotti
- Segnali visivi immediati
- Interpretazione facile anche per trader principianti
3. Affidabilità
- Meno suscettibile al rumore
- Segnali più puliti e definiti
- Riduzione dei falsi segnali rispetto al SuperTrend classico
Strategie d'Uso
Strategia di Seguito del Trend:
- Entrata: Principale > 0 per long, Principale < 0 per short
- Filtro: Istogramma con lo stesso segno della linea principale
- Uscita: Inversione di segno o raggiungimento di livelli estremi
Strategia di Momentum:
- Entrata: Principale > +30 (long) o Principale < -30 (short)
- Conferma: Istogramma in accelerazione
- Uscita: Decelerazione del momentum (istogramma in diminuzione)
Strategia di Reversione alla Media:
- Entrata: Principale > +80 (short) o Principale < -80 (long)
- Conferma: Inversione dell'istogramma
- Uscita: Ritorno verso la zona neutra
Condizioni di Mercato Ottimali
Mercati in Trend:
- Alta efficienza
- Segnali prolungati
- Meno falsi segnali
Mercati Laterali:
- Ridurre la dimensione del lotto
- Estendere il timeframe
- Usare come filtro di momentum
Buone Pratiche
Timeframe Consigliati:
- Intraday: M15 - H1
- Swing Trading: H4 - D1
- Position Trading: W1 - MN
Gestione del Rischio:
- Stop Loss: 1.5-2 × ATR
- Take Profit: 2-3 × Rischio
- Dimensione della Posizione: 1-2% per trade
Conferme Aggiuntive:
- Allineamento su più timeframe
- Conferma del volume
- Livelli chiave di supporto/resistenza
Limitazioni
Considerazioni:
- Ritardo intrinseco (indicatore di seguito al trend)
- Prestazioni ridotte in mercati laterali
- Necessità di conferme in bassa volatilità
Raccomandazioni:
- Combinare con analisi del price action
- Usare come filtro, non come sistema autonomo
- Testare in demo prima dell'uso live
Questo oscillatore rappresenta uno strumento potente per identificare trend forti e filtrare falsi segnali mantenendo una semplicità operativa adatta sia ai trader principianti che esperti.
Riepilogo
Recensioni dei clienti
5 | 0 % | |
4 | 100 % | |
3 | 0 % | |
2 | 0 % | |
1 | 0 % |


