Descrizione
Multi Timeframe Trend Scanner – Leggi l'intera storia del mercato a colpo d'occhio
Multi Timeframe Trend Scanner ti offre una vista chiara e compatta della tendenza attraverso più timeframe direttamente sul tuo grafico cTrader – da M5 fino a D1 – più un chiaro bias complessivo di trading:
➡️ Forte BUY / BUY / NEUTRALE / SELL / Forte SELL
Invece di saltare tra i grafici e indovinare, ottieni una mappa della tendenza multi-timeframe strutturata in un unico posto.
🧠 Motore Smart Trend Score
Per ogni timeframe abilitato (M5, M15, M30, H1, H4, D1), l'indicatore calcola un punteggio di tendenza robusto utilizzando tre componenti chiave:
- 📈 EMA (direzione e pendenza della tendenza)
-
- Prezzo rispetto a EMA (sopra/sotto)
- Pendenza EMA (in aumento/in diminuzione)
- 💪 RSI (momentum)
-
- Normalizzato intorno al livello 50
- 🌊 ATR (filtro di volatilità opzionale)
-
- Opzionalmente ignora condizioni di volatilità ultra-bassa
Ogni timeframe riceve un punteggio nell'intervallo -100 a +100, poi tradotto in uno stato semplice:
- 🟢 SU – bias rialzista
- 🔴 GIÙ – bias ribassista
- 🟡 PIATTO – laterale / poco chiaro
Vedi immediatamente quali timeframe sono d'accordo e dove si trova il vero bias direzionale.
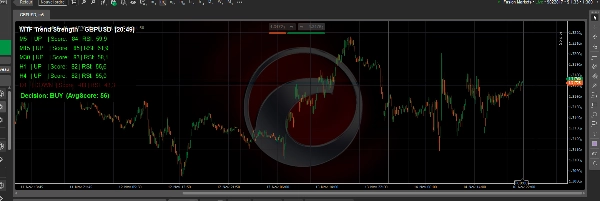
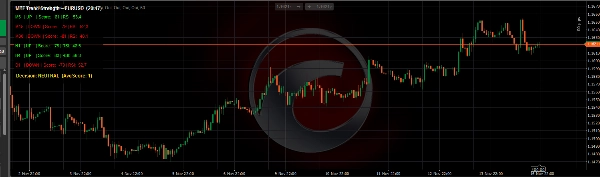
📊 Cruscotto pulito e leggero sul grafico
Lo strumento disegna un piccolo pannello UI sopra il tuo grafico, progettato per essere leggibile ma non invasivo:
- Una linea per timeframe, per esempio:
M15 | SU | Punteggio: 63 | RSI: 61.2 - Codificato a colori:
-
- Verde per SU
- Rosso per GIÙ
- Oro per PIATTO
- Il pannello può essere posizionato nell'angolo in alto a sinistra o in alto a destra
- Pannello regolabile:
-
- Colore di sfondo e opacità
- Dimensione del font
- Altezza della linea
- Colori per bias rialzista / ribassista / neutro
Perfetto per scalper, day trader e swing trader che vogliono confermare rapidamente il quadro più ampio.
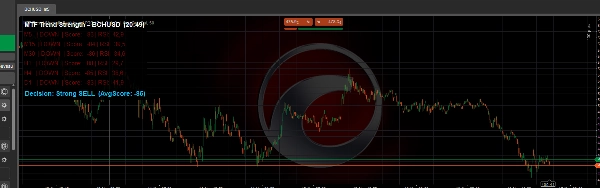
🧭 Linea di Bias Globale di Trading
In fondo al pannello, Multi Timeframe Trend Scanner calcola il punteggio medio di tutti i timeframe attivi e lo trasforma in un chiaro bias globale:
- ✅ Forte BUY – forte allineamento rialzista tra i timeframe
- ✅ BUY – bias rialzista, ma non estremo
- ⚪ NEUTRALE – mercato misto o instabile
- ❌ SELL – bias ribassista
- ❌ Forte SELL – forte allineamento ribassista
Questo lo rende ideale come filtro di tendenza e direzione per:
- Trading manuale (trada solo nella direzione del bias)
- Ingressi di scalping con conferma da timeframe superiori
- Swing trading allineato con H1 / H4 / D1
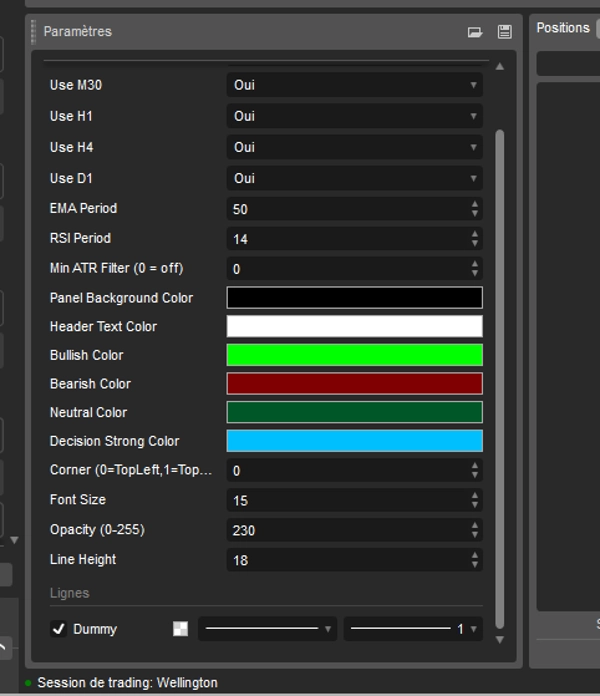
🔧 Completamente personalizzabile
Hai il pieno controllo sulla logica e sull'aspetto:
- Abilita/disabilita ogni timeframe (M5, M15, M30, H1, H4, D1)
- Configura:
-
- Periodo EMA (sensibilità della tendenza)
- Periodo RSI (comportamento del momentum)
- Filtro minimo ATR (0 = disattivato)
- Impostazioni visive:
-
- Colore di sfondo del pannello e trasparenza
- Colori del testo dell'intestazione e delle linee
- Colori per bias rialzista / ribassista / neutro / forte
- Dimensione del font e spaziatura delle linee
L'indicatore funziona su qualsiasi simbolo supportato da cTrader: forex, indici, oro, crypto, azioni.
Se vuoi un modo chiaro, oggettivo e visivo per leggere l'allineamento delle tendenze su più timeframe e decidere rapidamente se il mercato è più adatto per comprare, vendere o stare a guardare, Multi Timeframe Trend Scanner è un'aggiunta potente alla tua cTrader toolbox.
Riepilogo
The indicator displays a compact, color-coded dashboard on the chart, showing one line per timeframe with trend status, score, and RSI value. Users can customize the panel’s position, colors, font size, and which timeframes to include. A global trading bias line at the bottom summarizes the average score across timeframes into five bias states: Strong BUY, BUY, NEUTRAL, SELL, and Strong SELL. This feature supports manual trading, scalping, and swing trading by providing clear directional guidance.
Multi Timeframe Trend Scanner works on any cTrader-supported symbol, including forex, indices, commodities, cryptocurrencies, and stocks. It is designed to help traders quickly assess trend alignment and market bias in a single, easy-to-read interface.
Recensioni dei clienti
5 | 100 % | |
4 | 0 % | |
3 | 0 % | |
2 | 0 % | |
1 | 0 % |