Descripción
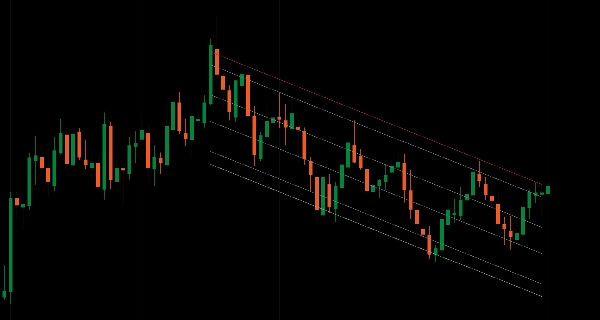
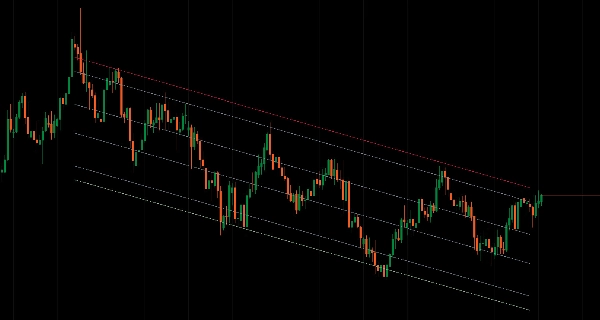
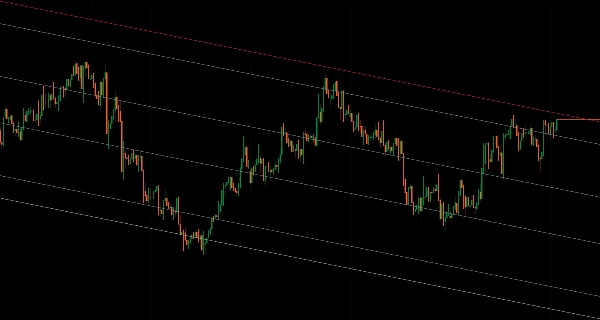
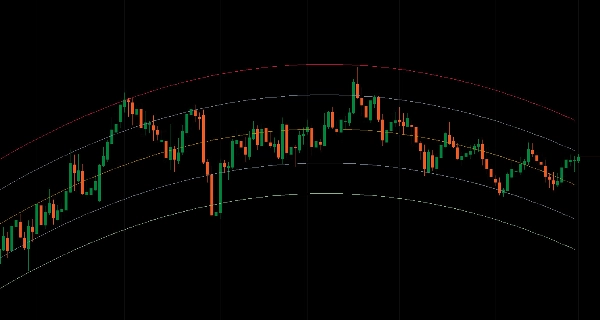
Canales de regresión estadística con niveles de Fibonacci a través de múltiples tipos de cálculo, marcos temporales y rangos de fechas.
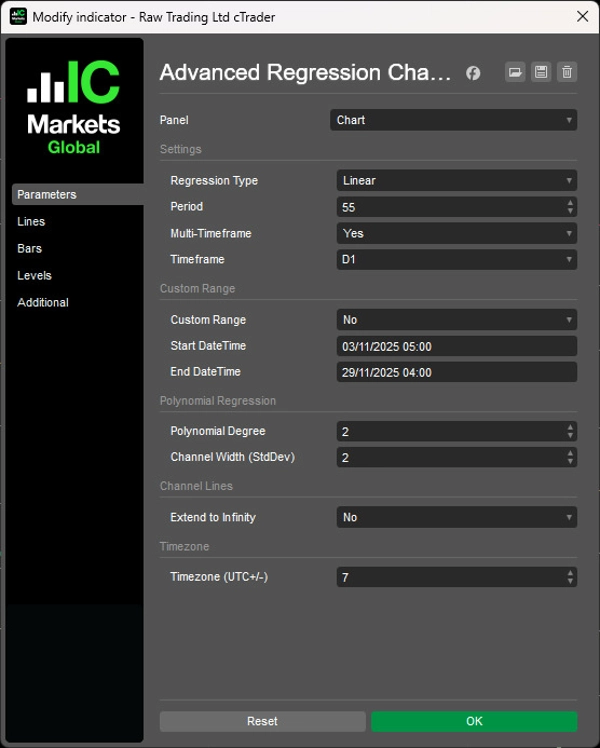
Ajusta líneas de regresión a través de datos de precios usando ocho métodos (Lineal, Logarítmico, Exponencial, Ponderado, Polinomial, Móvil, Media Móvil Exponencial, LOWESS) con bandas de desviación estándar para análisis de reversión a la media.
Niveles de canal Fibonacci nueve (0% a 100%), análisis multitemporal a través de 16 períodos con renderizado interpolado, tres modos de cálculo (Basado en Período, Rango de Fechas, MTF), control del grado polinomial (1-5) para estructuras de tendencia curvas, multiplicador de desviación estándar para ajuste del ancho del canal, análisis de eventos con análisis de fecha y hora consciente de la zona horaria, proyección de línea de tendencia extendida al infinito y caché LRU optimizada que ofrecen un análisis completo de regresión estadística para traders que buscan zonas de reversión a la media y estructuras de precios curvas en diversas condiciones de mercado.
CARACTERÍSTICAS
8 Tipos de Cálculo de Regresión
- Lineal: Regresión lineal clásica de mínimos cuadrados
- Logarítmico: Regresión basada en logaritmo natural para movimientos exponenciales de precios
- Exponencial: Ajuste de curva exponencial para tendencias aceleradas
- Ponderado: Regresión lineal con mayor peso en barras recientes
- Polinomial: Ajustes curvos (grado 1-5) para tendencias no lineales
- Móvil: Regresión basada en media móvil
- Media Móvil Exponencial: Regresión basada en EMA para suavizado de tendencias
- LOWESS: Regresión ponderada localmente para suavizado adaptativo
9 Niveles del Canal Fibonacci
- Rango completo del canal: 100% (superior), 88.6%, 76.4%, 61.8%, 50% (línea media), 38.2%, 23.6%, 11.4%, 0% (inferior)
- Zonas de reversión a la media dentro de las bandas de regresión
- Puntos de referencia precisos de soporte/resistencia
- Control independiente de color/estilo/grosor para cada nivel
Análisis Multitemporal
- Calcular regresión en marco temporal superior, mostrar en gráfico actual
- 16 marcos temporales disponibles (m1 a Mensual)
- Valores del canal interpolados para renderizado suave a través de barras del gráfico
- Estructura de marco temporal superior sin cambiar de gráfico
3 Modos de Cálculo
- Basado en Período: Ventana móvil de N barras (predeterminado)
- Rango de Fechas: Fecha/hora de inicio/fin personalizada para eventos o fases específicas con análisis de fecha y hora consciente de la zona horaria (desplazamiento UTC+/-)
Opciones de Visualización del Canal
- Salida Estándar: Graficar los 9 niveles como líneas del indicador
- Extender al Infinito: Renderizar como líneas de tendencia que proyectan hacia adelante indefinidamente
- Actualización automática cuando cambian colores/estilos
- Renderizado limpio—sin valores residuales más allá de la ventana de cálculo
Modo Rango de Fechas
- Definir fechas exactas de inicio/fin (formato dd/MM/yyyy HH:mm)
- Analizar eventos, fases o estructuras específicas del mercado
- Independiente del parámetro de período
- Conversión de zona horaria de hora local del usuario a hora del servidor
Cálculo Dinámico
- Actualizaciones en tiempo real a medida que se forman nuevas barras
- Caché LRU optimizada con seguimiento de rango sucio
- Tamaño de caché adaptativo basado en el marco temporal
- Búsqueda binaria para búsquedas rápidas en rango de fechas
Control del Ancho del Canal
- Multiplicador de desviación estándar (predeterminado 2.0)
- Bandas más anchas para expansión de volatilidad
- Bandas más estrechas para mercados en rango
- Consistente en todos los tipos de regresión
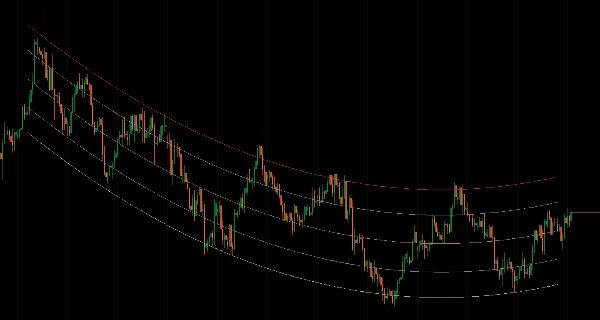
Regresión Polinomial
- Control de grado: 1-5 (mayor = más curvatura)
- Captura tendencias no lineales
- Útil para estructuras de precios parabólicas o curvas
- Vuelve a lineal cuando el grado = 1
Gestión Visual Limpia
- No se calcula en barra en formación—solo barras completadas
- Truncamiento adecuado multitemporal—las líneas terminan en la última barra HTF completada
- Extrapolación basada en pendiente para proyección direccional consistente
- Serie de salida clara con nombres descriptivos de niveles
__________________________________________________________________________________________
MÁS INDICADORES GRATUITOS
Explora una amplia gama de herramientas de análisis de mercado—desde estructura y volumen hasta regresión, volatilidad y marcos temporales personalizados.
El código fuente está disponible en el repositorio de GitHub.
Todos son gratuitos. Pero si deseas apoyar con un café, puedes hacerlo aquí.
Soporte/Resistencia
Volumen
- Perfilador de Actividad de Volumen
- Analizador de Eficiencia de Volumen
- Análisis de Perfil de Volumen
- Perfil de Volumen - Actualizado
- Análisis de Spread de Volumen
- VWAP (Precio Promedio Ponderado por Volumen)
Medias Móviles
- Canal SSL
- Media Móvil Anclada
- Media Móvil Escalada por Desviación
- Activador Gann Alto Bajo
- Línea de Tendencia Instantánea
- Media Móvil Adaptativa Kaufman con Visión de Tendencia
- Canal de Media Móvil
- Suite de Medias Móviles
- Media Móvil de Canal de Tendencia
Utilidades/Personalizados
Basado en Regresión
Volatilidad
Osciladores
__________________________________________________________________________________________
DESCARGO DE RESPONSABILIDAD
El trading implica riesgos. Este indicador está destinado solo para análisis técnico — siempre aplique una gestión adecuada del riesgo y opere con responsabilidad.
COMENTARIOS Y MEJORAS
Si tienes sugerencias, solicitudes de funciones o ideas para mejorar, por favor deja un comentario en la pestaña de Discusión. Tus comentarios ayudan a mejorar el indicador para todos.
Resumen
It offers multi-timeframe analysis across 16 periods (from 1 minute to monthly), enabling regression calculations on higher timeframes displayed on the current chart with smooth interpolated rendering. Users can select among three calculation modes: Period-Based (rolling window), Date Range (custom start/end with timezone-aware parsing), and Multi-Timeframe. Channel width is adjustable via a standard deviation multiplier to reflect market volatility.
The indicator features real-time dynamic updates, optimized caching for performance, and extend-to-infinity trendline projections for forward-looking analysis. Visual output is clean, with slope-based extrapolation and no calculations on forming bars. This tool is designed for traders analyzing mean reversion and complex price structures across various market conditions.