MultiTimeframe Pivot Levels Pro
Indikator
Versi 1.0, Nov 2025
Windows, Mac
Deskripsi
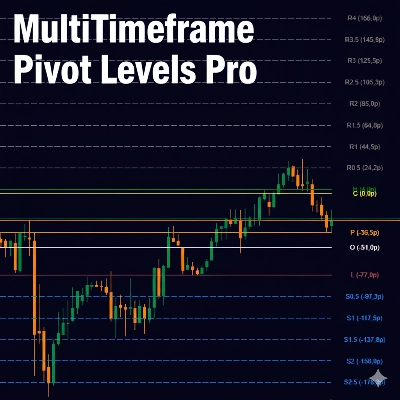
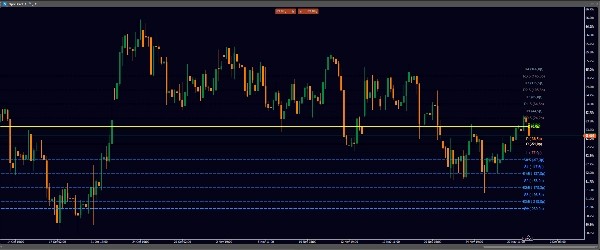
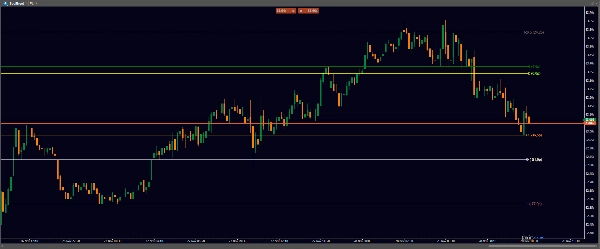
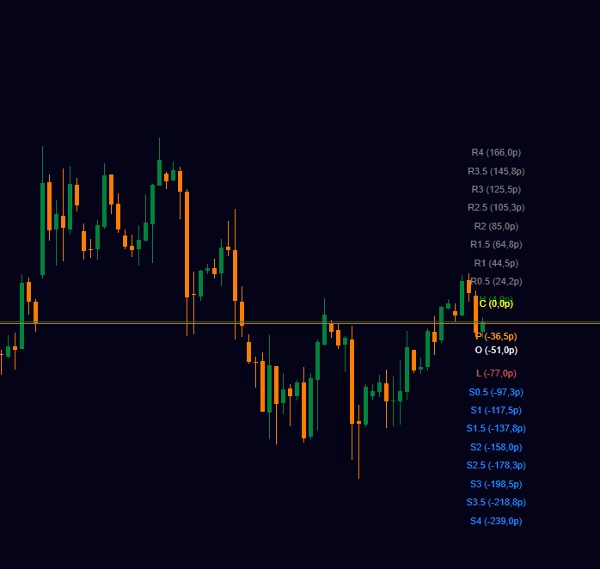
MultiTimeframe Pivot Levels Pro adalah indikator trading canggih yang menampilkan titik pivot dan level support/resistance dari timeframe yang lebih tinggi langsung pada grafik Anda saat ini. Alat yang kuat ini membantu trader mengidentifikasi level harga kunci untuk titik masuk dan keluar yang strategis.
Fitur Utama:
- Analisis multi-timeframe (menampilkan pivot Harian, Mingguan, Bulanan pada grafik apa pun)
- 8 level support dan 8 level resistance untuk struktur pasar yang komprehensif
- Dua metode perhitungan pivot (Klasik: H+L/2, Standar: H+L+C/3)
- Warna dan visibilitas yang dapat disesuaikan untuk semua level
- Tampilan jarak dalam pips dari harga saat ini
- Performa yang dioptimalkan untuk operasi yang lancar
- Presentasi visual yang bersih dan profesional
Sangat Cocok Untuk:
- Trader swing yang menggunakan multiple timeframe
- Trader harian yang membutuhkan level referensi kunci
- Trader price action yang mengidentifikasi support/resistance
- Semua gaya trading yang mencari trading berbasis level yang tepat
Ringkasan
Profil indikator
Ulasan pelanggan
0.0
Ulasan: 0
Ulasan pelanggan
Belum ada ulasan untuk produk ini. Sudah mencobanya? Jadilah pemberi ulasan pertama!
Diskusi
Pertanyaan umum
BTCUSD
Forex
Indices
EURUSD
Commodities
GBPUSD
NZDUSD
Crypto
Stocks
XAUUSD
NAS100
USDJPY
Produk-produk yang tersedia melalui cTrader Store, termasuk bot trading, indikator, dan plugin, disediakan oleh pengembang pihak ketiga serta hanya ditujukan untuk akses teknis dan informasi. cTrader Store bukan broker dan tidak menyediakan saran investasi, rekomendasi pribadi, atau jaminan apa pun tentang kinerja di masa mendatang.
Produk lain dari penulis ini


![Logo "[Stellar Strategies] Smart ADX"](https://cdn.ctrader.com/image/webp/af13b084-b6f6-41db-b7bc-c7e688b57b05_36929)


Harga
Sejak 28/12/2024
54
Instal gratis