Trading product for VGM - Auto Fibo Retracement 지표, image 1
지표
1.07K 다운로드
버전 1.0, Dec 2024
Windows, Mac
3.3
리뷰: 3
Trading product for VGM - Auto Fibo Retracement 지표, image 2
가입일 17/12/2024
1.07K
무료 설치

설명

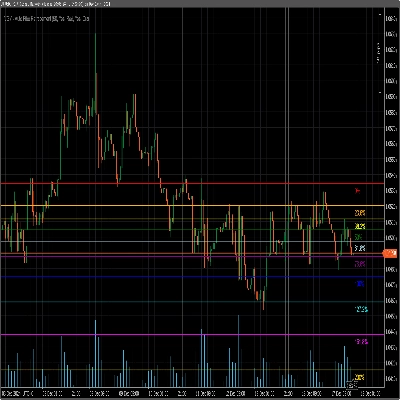
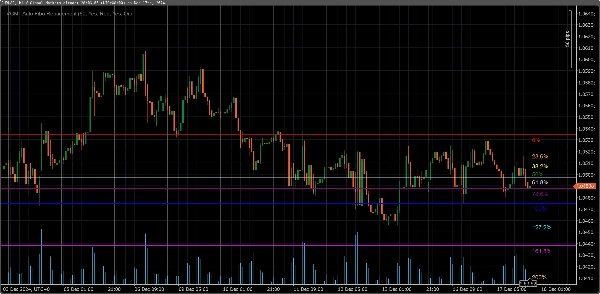
이 자동 피보나치 되돌림 지표는 사용자 지정 가능한 조회 기간 내에서 최고점과 최저점을 기준으로 차트에 피보나치 되돌림 수준을 자동으로 계산하고 그립니다. 사용자는 색상을 구성하고 127.2%, 161.8%, 200%, 261.8%와 같은 100% 이상의 인기 확장 레벨을 포함하여 특정 피보나치 레벨을 활성화하거나 비활성화할 수 있습니다.

주요 기능:
1. **자동 스윙 감지**: 선택한 조회 기간 내에서 스윙 고점과 저점을 동적으로 감지합니다.
2. **사용자 지정 가능한 레벨**: 선호에 따라 특정 피보나치 레벨을 활성화하거나 비활성화할 수 있습니다.
3. **색상 설정**: 각 레벨에 대해 개별 색상을 선택하여 시각적 구분을 향상시킵니다.
4. **확장 레벨**: 추세 지속 분석을 위한 일반적으로 사용되는 확장(127.2%, 161.8%, 200%, 261.8%)을 포함합니다.
5. **실시간 업데이트**: 시장 상황 변화에 따라 레벨이 자동으로 조정됩니다.

적합 대상:
- 진입/퇴출 레벨로 피보나치 되돌림 및 확장을 사용하는 트레이더.
- 깔끔하고 유연하며 자동화된 피보나치 도구가 필요한 사용자.


VantoFX에서 제작. https://vantofx.com 모두에게 무료입니다.

요약

AI 요약
The VGM - Auto Fibo Retracement is an indicator that automatically calculates and plots Fibonacci retracement levels on trading charts. It identifies the highest high and lowest low within a user-defined lookback period to determine swing points dynamically. Users can customize which Fibonacci levels to display, including standard retracements and extended levels such as 127.2%, 161.8%, 200%, and 261.8%, commonly used for analyzing trend continuation. Each level’s color can be individually set for clear visual distinction. The indicator updates in real time to reflect changing market conditions, providing an automated and flexible tool for traders who use Fibonacci retracement and extension levels to identify potential entry and exit points.
지표 프로필

고객 리뷰

3.3
리뷰: 3
5
33 %
4
33 %
3
0 %
2
0 %
1
33 %
고객 리뷰
January 21, 2026
Sadly this iindicator makes drawings like trend lines, horizobtal lines, Fibonacci etc disappear within a second of traying to draw them. Obviously a problem with the coding so fix it and it would be worth a 5*
August 10, 2025
This is helpful my friend, thanks for the upload :)
July 9, 2025
Pros: Automatically detects swing points and plots Fibonacci retracement levels. Easy to use, customizable, works across timeframes. Cons: No tooltips or alerts. Lacks template saving and historical swing tracking. Requires additional confirmation tools for reliable trading.

상담

자주 묻는 질문(FAQ)

트레이딩 봇, 지표, 플러그인 등 cTrader Store에서 제공되는 상품은 제3자 개발자에 의해 제공되며, 이는 단순히 정보 및 기술적 접근을 목적으로 제공된 것입니다. cTrader Store는 중개인이 아니며, 투자 조언, 개인별 추천 또는 향후 성과에 대한 어떠한 보장도 제공하지 않습니다.

좋아하실 만한 다른 항목

지표
Smart Liquidity Zones PRO auto-detects liquidity grabs, wicks, traps & manipulations — trade like the smart money.
지표
Prop
Forex
+7
The Parabolic SAR, or "Stop and Reverse," is a dynamic technical analysis tool.
지표
RSI
MACD
+3
A comprehensive cTrader indicator designed to give you a quick, at-a-glance understanding of market sentiment 📈📉
지표
VWAP
Forex
+7
VWAP + Swing Liquidity + SFP Signals — detects liquidity sweeps with color-coded alerts.
지표
EMA
MACD
+2
Combines MACD's Fast/Slow EMAs with a dynamic Volume Profile, coloring volume by direction and highlighting the POC.
지표
MSS
Key Levels
+4
Maps session ranges, previous highs/lows, equilibrium and premium/discount zones on your cTrader chart.
지표
Forex
cTrader Auto Support & Resistance detects key levels with Fibonacci analysis and sends real-time trading alerts.
지표
EMA
SMA
+2
Smart volume analysis with BP detection, trend confirmation and breakout signals for professional traders.
지표
RSI
Breakout
+1
🚀 TrendHeikinMultiMA: Advanced trend detection using Heikin-Ashi smoothing & MAs! Eliminates noise, confirms real trend
지표
RSI
Prop
+12
🧠Visually marks momentum zones when the RSI crosses the overbought/oversold thresholds (default 70/30). ✅
지표
Prop
Forex
+13
Supertrend - Multi-Timeframe Indicator
지표
Chaikin money flow's primary purpose is to distinguish between periods of accumulation and distribution of a security.
지표
SMC
Prop
+9
PDL/PDH/PWL/PWH and Session higs/lows (customizable)
지표
MSS
Key Levels
+2
Maps equal highs, equal lows and active liquidity pools directly on your cTrader chart.
지표
Forex
BTCUSD
+5
Buy-Side & Sell-Side Liquidity (BSL/SSL) Indicator
지표
Prop
Forex
+5
Tracks NY, London, Tokyo, Sydney sessions with custom visuals, and a real-time expanding range box and breakout High/Low
지표
RSI
SMC
+3
High Low Divergence is a clean, overlay indicator that automatically identifies swing highs and swing lows
지표
VWAP
Volume
+3
Don't trust static support and resistance levels, this indicator combines Fibonacci and VWAP in one powerful tool.

가격

가입일 17/12/2024
1.07K
무료 설치