Descrizione
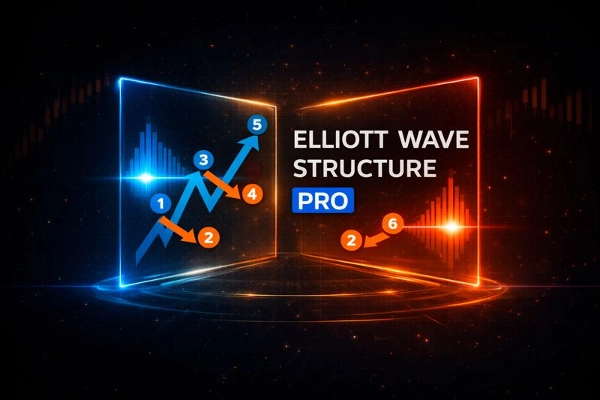
Continuazione Elliott Wave-3 & Inversioni Elliott
Struttura Elliott Wave è un indicatore progettato per analizzare la struttura del mercato con la teoria delle onde di Elliott.
Combina analisi degli swing confermati, struttura di mercato, rilevamento degli impulsi di Elliott, e un dedicato continuazione da onda 2 a onda 3.
Questo strumento è stato creato per trader che richiedono chiarezza, conferma ed esecuzione basata su regole, non disegni soggettivi.
Motore Swing Non-Ripitturante
Tutti i calcoli si basano su punti di swing confermati utilizzando:
- Profondità dello swing regolabile
- Deviazione minima del prezzo (filtro pip)
- Barre di conferma
Una volta che uno swing è stampato, non si muove mai, garantendo piena affidabilità storica.
Analisi della Struttura di Mercato:
Identifica e etichetta automaticamente:
- Massimo più alto (HH)
- Minimo più alto (HL)
- Massimo più basso (LH)
- Minimo più basso (LL)
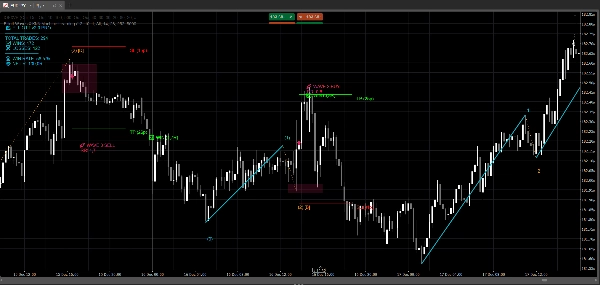
Rilevamento Impulsi Elliott Wave:
L'indicatore rileva automaticamente impulsi completi a 5 onde di Elliott in entrambe le direzioni:
- Rialzista: L-H-L-H-L-H
- Ribassista: H-L-H-L-H-L
Valida gli impulsi usando regole interne:
- Forza dell'onda 3
- Logica di ritracciamento delle onde 2 e 4
- Proporzionalità dell'onda 5
Ogni impulso è valutato usando un punteggio di qualità (0–100) ed etichettato direttamente sul grafico.
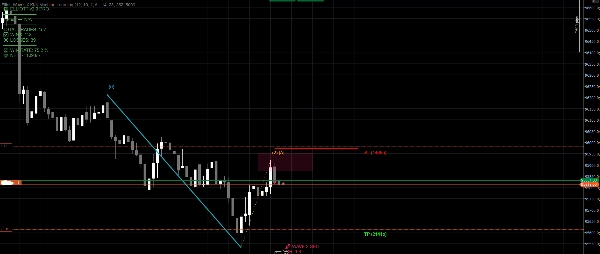
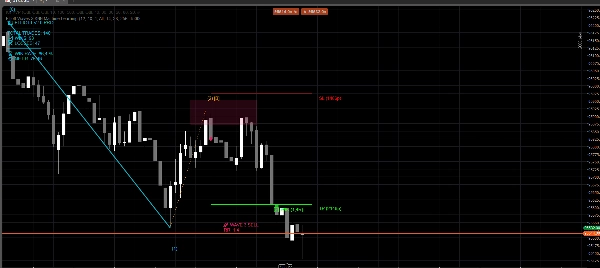
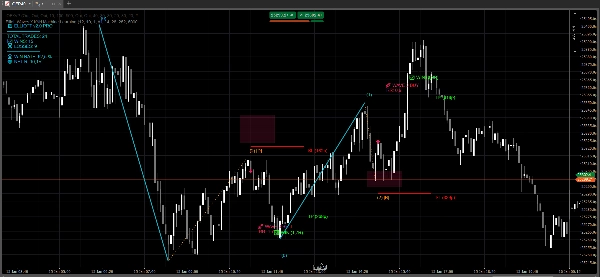
Setup di Continuazione Onda-3 (Modulo di Trading Primario)
Questo è il componente principale di trading dell'indicatore.
Il sistema identifica strutture di continuazione Onda 0-1-2 e prepara gli ingressi per l'Onda 3:
- Rialzista: Minimo → Massimo → Minimo più alto
- Ribassista: Massimo → Minimo → Massimo più basso
I criteri di validazione includono:
- Ritracciamento dell'onda 2 tra il 23,6% e l'88,6%
- Nessuna invalidazione attraverso l'onda 0
- Allineamento del trend usando la struttura di mercato
- Forza dell'onda 1 rispetto all'ATR
- Il prezzo deve trovarsi su OB
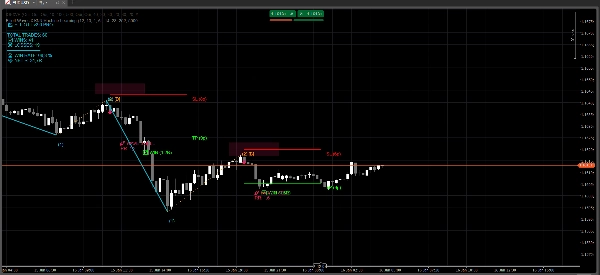
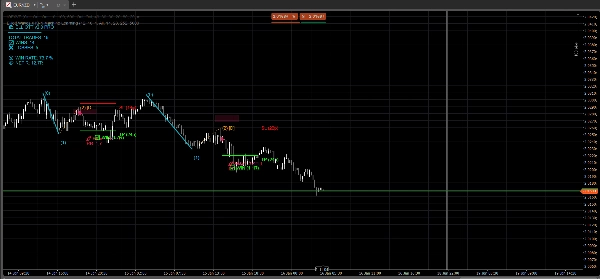
Quando validato, l'indicatore disegna automaticamente:
- Struttura delle onde 1 e 2
- Zona di ingresso OB
- Segnale di ingresso
- Stop Loss basato su ATR oltre l'onda 2
- Take Profit basato sulla proiezione ATR
Gestione del Rischio e del Trade
- Stop Loss e Take Profit sono calcolati dinamicamente usando ATR
- Il rapporto rischio-rendimento è mostrato direttamente sul grafico
- Progettato per evitare setup sovraestesi o di bassa qualità
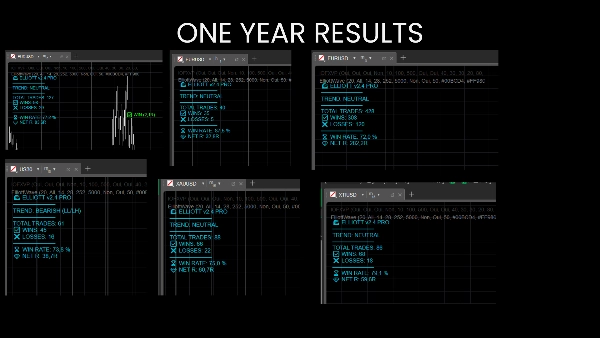
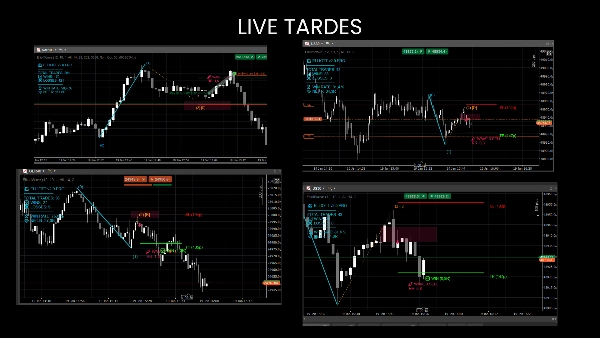
Personalmente lo uso per fare scalping sugli indici su M1 & M5, ma funziona anche con FX, materie prime, azioni, ecc... Il cruscotto mostra se è stato redditizio su un particolare asset.
La versione gratuita ti permette di provare sui principali FX M15.