Rolling Z-Score Trend Heat — Veja a Temperatura do Mercado em Tempo Real
✅ 9 modos inteligentes de calor — do sinal bruto à força confirmada por MTF ✅ Linha MA HeatFlow PRO com efeitos de brilho, névoa, faixa e pulso ✅ Confirmação de Z-Score em múltiplos períodos com validação de inclinação ✅ Detecção de regime de volatilidade + filtro ADX para mercados laterais embutido ✅ Setas de entrada/saída com filtro de direção MA para sinais limpos e alinhados
Este não é um oscilador de momentum que você observa em uma subjanela. O Rolling Z-Score Trend Heat pinta a força estatística do mercado diretamente no seu gráfico — como cor, como calor, como uma linha MA brilhante que mostra exatamente o que a tendência está fazendo agora.
Por que Z-Score — e por que funciona
A maioria dos indicadores reage ao preço. Este mede o quão longe o preço se moveu em relação à sua própria história recente, normalizado pela volatilidade. Isso significa que o sinal se adapta automaticamente — sem necessidade de recalibrar para diferentes sessões, símbolos ou períodos.
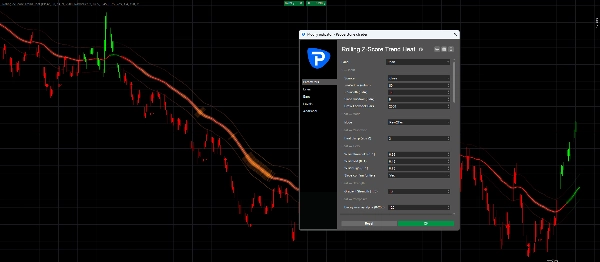
9 modos de calor — uma ferramenta, todas as condições de mercado
De um sinal bruto limpo em duas cores ao sobreposição completa de Força Composta + Decaimento, você escolhe quão agressivamente o calor responde ao preço. O modo Filtro Chop diminui os sinais durante mercados laterais usando um motor ADX embutido. O modo Confirmação MTF só mostra calor total quando o período superior concorda. Você adapta o indicador à sua sessão — não o contrário.
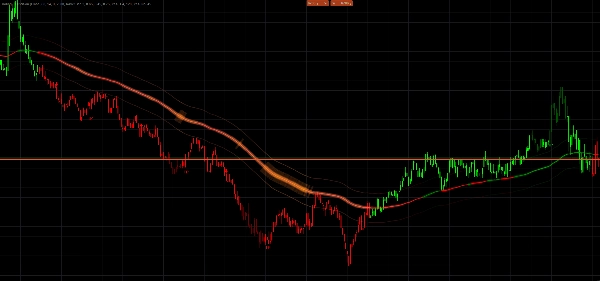
A Linha MA HeatFlow — clareza visual de nível profissional
O centro deste indicador é uma linha MA em gradiente que muda de cor com base na direção da tendência e força do momentum. Tendência fraca? Cor base suave. Momentum em construção? A linha clareia, o brilho se expande e uma névoa de calor aparece ao redor. Mudança de direção? Uma explosão de pulso marca o momento exato. É o mesmo motor usado no indicador MA HeatFlow PRO — totalmente integrado aqui.
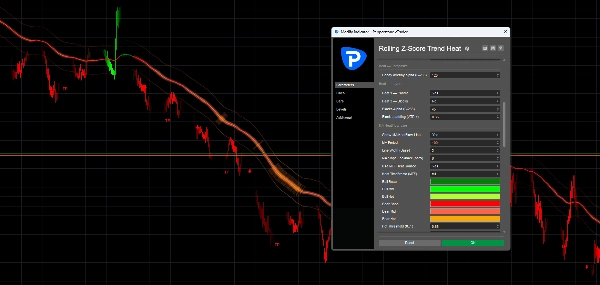
Sinais que realmente filtram
Setas de entrada e saída são acionadas por cruzamentos de Z-Score com confirmação de inclinação — para que você não persiga ruído. Ative o filtro de direção MA e as setas só disparam quando a linha HeatFlow concorda com a direção do sinal. Setas de inversão de tendência marcam mudanças de regime no momento em que Z-Score e inclinação se alinham. Rótulos de TP aparecem automaticamente quando a condição de saída é atendida.
Construído para gráficos de ticks e M1 — ajustado para velocidade
As configurações padrão são otimizadas para M1 e Tick30–Tick100. O sistema de limite de lookback mantém os objetos do gráfico limpos e o desempenho estável mesmo em dados densos de ticks.
Se você quer um gráfico que mostre força da tendência, estado do momentum e temporização do sinal em um único olhar — esta é a ferramenta.


![Logótipo de "[Hamster-Coder] Pivot Points MTF"](https://cdn.ctrader.com/image/webp/4c143e5a-309c-40e3-a578-f04d1e133ffa_31159)


