
Dominator M4tr1x
Questo è uno strumento informativo di base che combina l'analisi della struttura dei prezzi smart-money sul grafico con più pannelli di dashboard informativi. Ecco una panoramica di ogni sistema principale:
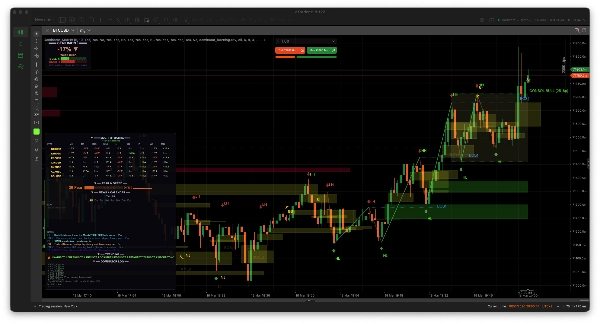
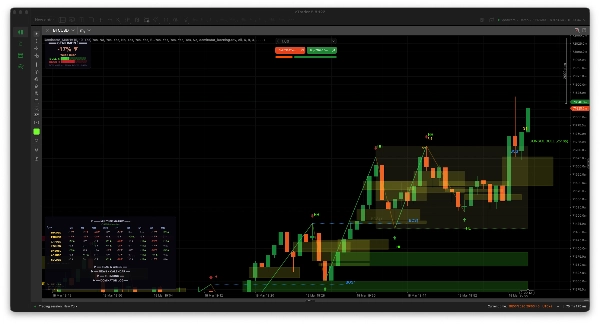
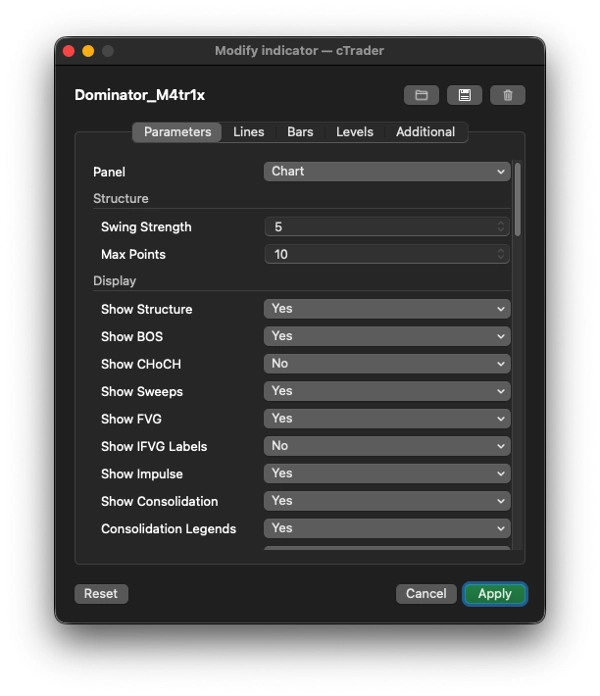
1. 📊 SUL GRAFICO: Analisi della Struttura Smart Money
Disegna direttamente sul grafico dei prezzi:
Caratteristica
Cosa fa ;
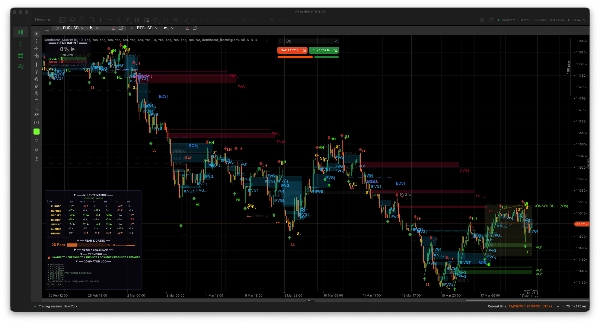
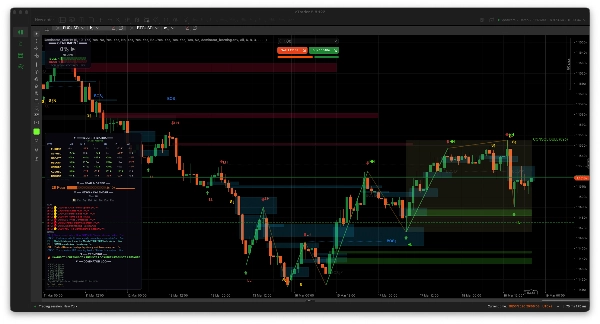
Rilevamento Swing
Identifica massimi/minimi swing usando una forza di lookback configurabile, li segna con frecce (▲/▼)
Etichette di Struttura
Etichetta ogni swing come HH (Higher High), HL (Higher Low), LH (Lower High), LL (Lower Low) per mappare la struttura del mercato
BOS (Break of Structure)
Disegna linee tratteggiate + etichette quando il prezzo rompe un precedente massimo/minimo swing nella direzione del trend
CHoCH (Change of Character)
Uguale a BOS ma contro il trend — segnala una potenziale inversione di trend
Invalidazione della rottura
Se il prezzo torna indietro attraverso un livello BOS/CHoCH, lo segna come fallito (grigio con ✗) e lo registra
Spazzate di Liquidità
Rileva quando il prezzo supera un massimo swing (o scende sotto un minimo swing) ma chiude di nuovo all'interno — un classico schema di cattura della liquidità
FVG (Fair Value Gaps)
Rileva squilibri a 3 candele (gap tra il massimo della candela 1 e il minimo della candela 3). Disegna rettangoli colorati sul grafico
IFVG (FVG Inverso)
Quando il prezzo torna a riempire un FVG, lo etichetta come "IFVG" (il gap diventa una potenziale zona di supporto/resistenza)
Invalidazione FVG
Se il prezzo chiude decisamente attraverso una zona FVG, viene segnato come invalidato
Onde d'Impulso
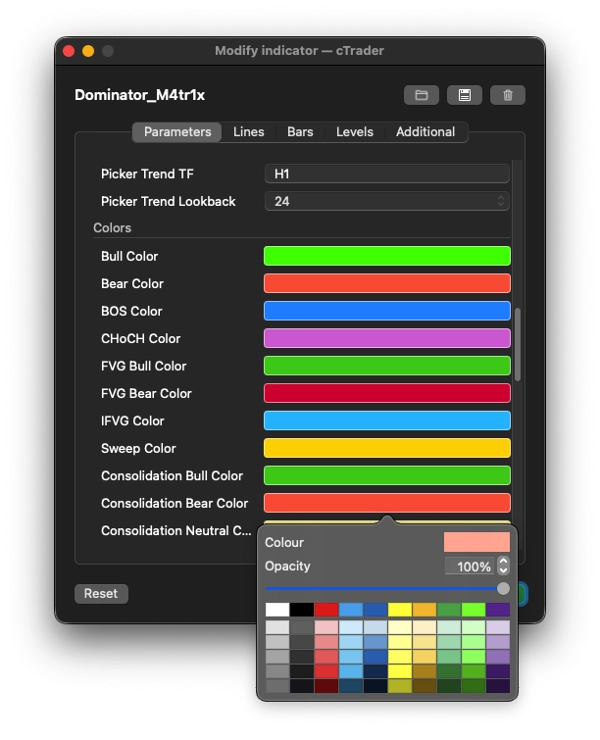
Collega i punti swing con linee di tendenza — verde per gambe d'impulso (con il trend), giallo per gambe correttive
Zone di Consolidamento
Rileva quando massimi e minimi swing consecutivi sono entro un intervallo ristretto basato su ATR, disegna un riquadro con etichetta "CONSOL BULL/BEAR/NEUTRAL" che mostra bias di direzione e larghezza in pip
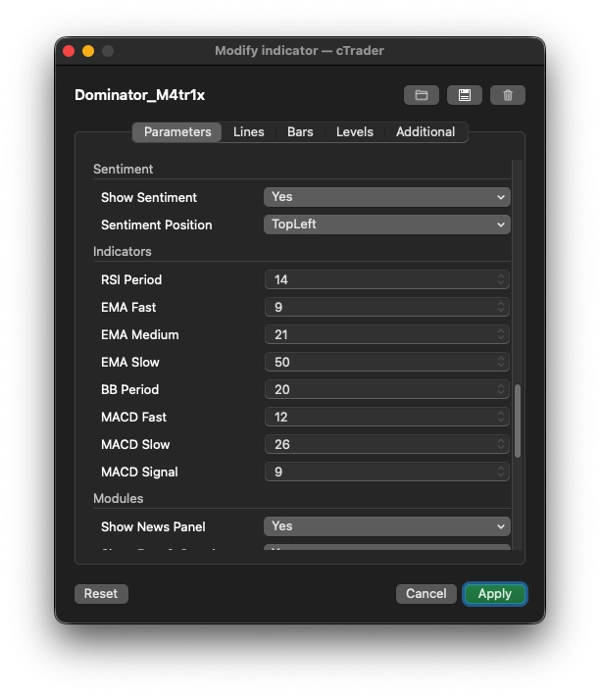
2. 📈 PANNELLO SENTIMENT (in alto a sinistra per impostazione predefinita)
Un indicatore di punteggio toro/orso in tempo reale per il simbolo/intervallo temporale corrente del grafico utilizzando:
- RSI (ipervenduto/ipercomprato + rilevamento divergenze)
- MACD (incroci, momentum dell'istogramma)
- 3 EMA (allineamento veloce/medio/lento e posizione del prezzo rispetto a esse)
- Bande di Bollinger (prezzo agli estremi superiore/inferiore della banda)
Mostra:
- Un punteggio percentuale da -100% a +100% (es., "+67% TORO FORTE")
- Barre punti visive toro vs. orso (█████░░░░)
- Statistiche segnale in corso (segnali totali, confermati, invalidati, % di accuratezza)
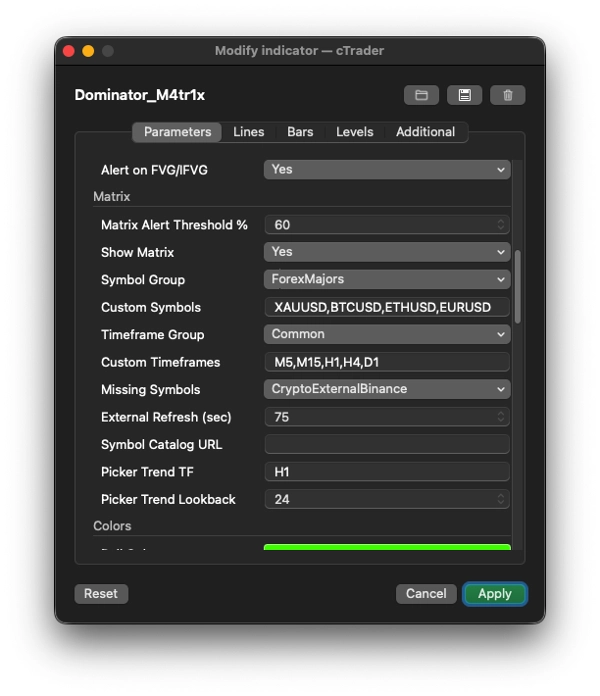
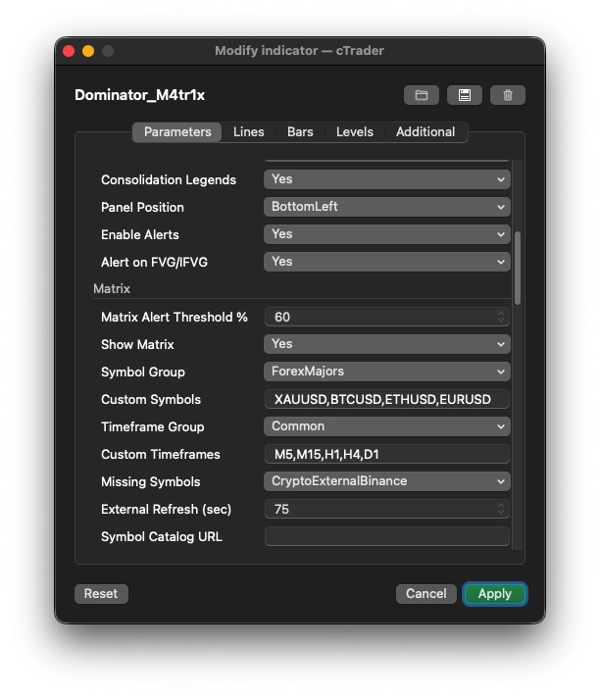
3. 🔢 MATRICE MULTI-TIMEFRAME (pannello principale)
Una griglia/mappa di calore che mostra i punteggi di sentimento toro/orso su più simboli × più timeframe simultaneamente.
Aspetto
Dettagli
Gruppi di simboli
Forex Major/Minor/Esotici, Crypto, Indici, Azioni USA, Metalli, Energia, Materie prime o Personalizzati
Gruppi di timeframe
Comuni (M5–W1), Tutti o Personalizzati
Ogni cella
Mostra un punteggio codificato a colori come "+42▲" (verde) o "-67▼" (rosso) usando lo stesso motore di punteggio RSI/MACD/EMA/BB
Risoluzione simbolo
Estremamente robusta — rileva automaticamente le convenzioni di denominazione del broker (suffissi come .r, m, .cash, slash come EUR/USD), prova dozzine di permutazioni di alias, memorizza i risultati nella cache
Dati esterni
Per simboli non supportati dal broker (specialmente crypto), recupera dati OHLC da Binance, Bybit, OKX, Kraken, Bitfinex API (gratis, senza chiave necessaria)
API Premium
Supporta opzionalmente TwelveData, AlphaVantage, Polygon, Stooq per azioni/indici/forex tramite chiavi API
Interattivo
Clicca su qualsiasi nome simbolo → apre un selettore simboli ricercabile con oltre 100 simboli in tutte le categorie, mostrando la variazione % a 24h. Clicca su qualsiasi intestazione di timeframe → apre un selettore timeframe per scambiare colonne
Avvisi
Quando qualsiasi cella supera una soglia configurabile (es., ±60%), riproduce un suono di avviso
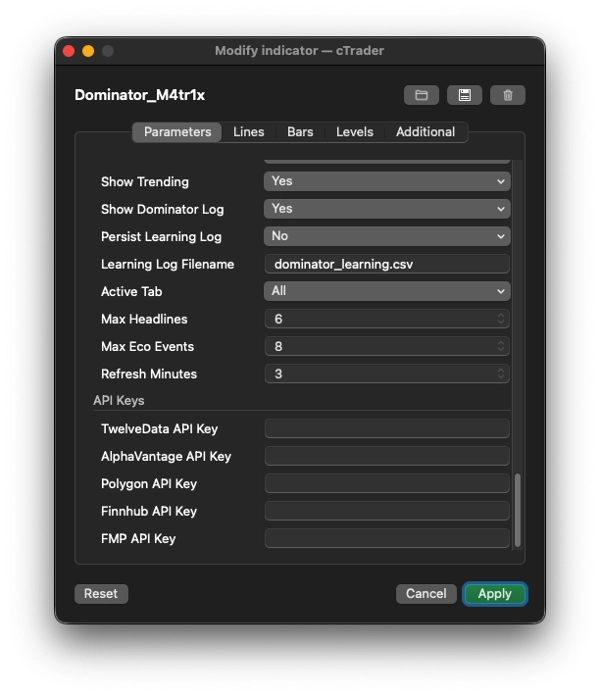
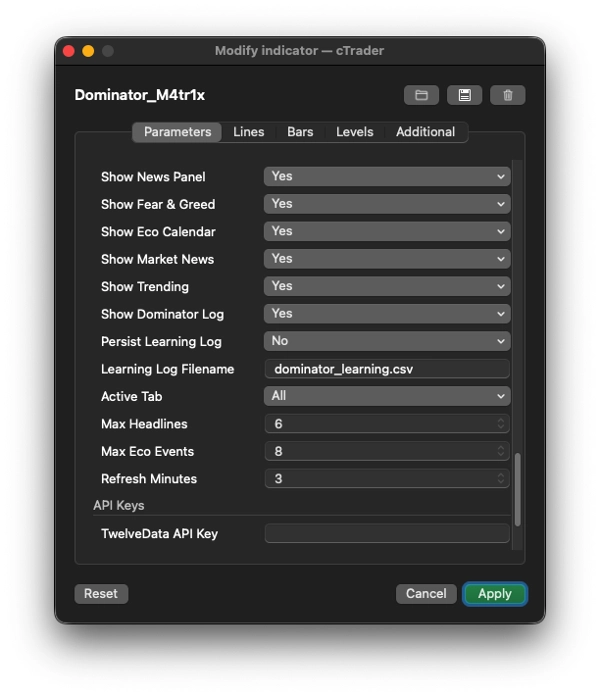
4. 📰 PANNELLI NOTIZIE + INFORMAZIONI
Calendario Economico
Aggrega eventi economici ad alto/medio impatto imminenti da 8+ fonti ridondanti:
- ForexFactory (JSON + XML), TradingView, Finnhub, TradingEconomics, MQL5, FXStreet, FMP (FinancialModelingPrep)
- Codificato a colori per urgenza (rosso = ORA, arancione = <15 min, giallo = <1 ora, verde = più tardi)
Titoli di Notizie di Mercato
Aggrega da 12+ fonti RSS/API:
- Crypto: CryptoCompare, CoinDesk, CoinTelegraph, NewsBTC, annunci Binance, stato sistema OKX
- Forex: FXStreet, ForexLive
- Indici/Azioni: MarketWatch, CNBC, Reuters, Yahoo Finance
- Auto-categorizza i titoli (crypto/forex/metalli/energia/azioni) tramite rilevamento parole chiave
- Filtrabile per scheda (Tutti, Forex, Crypto, Metalli, Indici, Azioni, Energia, Economico)
Indice Paura & Avidità
- Recupera l'Indice Crypto Paura & Avidità (API alternative.me, con fallback CNN Business)
- Mostra valore numerico (0–100), etichetta (Paura estrema → Avidità estrema), barra colore, e storico sparkline a 7 giorni (▁▂▃▄▅▆▇█)
Trending
- Recupera i principali movimenti crypto dal ticker 24h di Binance (top 5 guadagni + top 5 perdite)
- Fallback su trending di CoinGecko o CoinPaprika
5. 📝 LOG DOMINATOR + SISTEMA DI APPRENDIMENTO
- Tiene un registro segnali mostrando gli ultimi 8 segnali con stato (● attivo, ✓ confermato, ✗ invalidato)
- Traccia le statistiche di accuratezza complessive (segnali totali, conferme, invalidazioni, % di accuratezza)
- Persistenza CSV opzionale: scrive ogni evento segnale (nuovo/conferma/invalidazione) in un file CSV (
dominator_learning.csv) con metadati completi — progettato per alimentare futuri machine learning o backtesting
6. 🛠 Punti salienti dell'Architettura Tecnica
- Overlay completo (
IsOverlay = true) — disegna sul grafico dei prezzi, non in un pannello separato - AccessRights = None — esegue nella sandbox del broker (nessun accesso a file system/rete oltre a quanto consente cAlgo)
- Recupero dati asincrono — tutte le chiamate HTTP vengono eseguite su thread in background tramite
Task.Run()per non bloccare mai il grafico - Caching intelligente — risoluzione simboli, dati OHLC esterni, prezzi ticker e percentuali di trend sono tutti memorizzati nella cache con intervalli di aggiornamento configurabili
- Ritenta automaticamente — risoluzioni simboli fallite e recuperi dati esterni ritentano ogni 45 secondi
- Sezioni comprimibili — ogni sezione del pannello (Matrice, Paura & Avidità, Notizie, Trending, Log) può essere compressa/espansa cliccando sull'intestazione
In sintesi
Dominator M4tr1x è un indicatore informativo che sostituisce un'intera dashboard di trading. Mappa la struttura smart-money sul grafico (BOS, CHoCH, FVG, spazzate, consolidamento), valuta il sentimento multi-asset/multi-timeframe tramite indicatori tecnici, aggrega calendari economici e notizie di mercato da oltre 20 fonti, traccia Paura & Avidità, mostra asset di tendenza, registra tutti i propri segnali con tracciamento dell'accuratezza e permette di scambiare simboli e timeframe in modo interattivo — il tutto recuperando dati mancanti da oltre 5 API di exchange esterni in background.
5 | 0 % | |
4 | 100 % | |
3 | 0 % | |
2 | 0 % | |
1 | 0 % |


