present
ลงทะเบียนและรับส่วนลด $50 สำหรับการซื้อครั้งแรกของคุณ
Trading product for Sync Lines อินดิเคเตอร์ Key Levels Support & Resistance, image 1
Sync Lines
อินดิเคเตอร์
เวอร์ชัน 1.0, May 2026
Windows, Mac
Trading product for Sync Lines อินดิเคเตอร์ Key Levels Support & Resistance, image 2
Trading product for Sync Lines อินดิเคเตอร์ Key Levels Support & Resistance, image 3
ตั้งแต่ 06/04/2026

คำอธิบาย

Professional Multi-Chart Level Synchronization Tool for cTrader

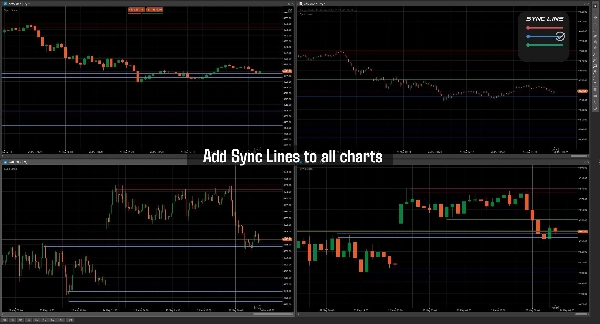
Sync Horizontal Lines is a professional charting utility built for traders who rely heavily on support/resistance zones, liquidity areas, market structure, and multi-timeframe analysis inside cTrader. The indicator allows traders to draw horizontal price levels once and automatically synchronize them across all charts of the same symbol instantly.

Unlike traditional manual chart marking, Sync Horizontal Lines removes repetitive work by keeping levels aligned between different timeframes and chart layouts. Whether you are analyzing M1, M15, H1, or Daily charts, your important levels remain fully synchronized and visually consistent.

The indicator includes a fast hotkey-based workflow for creating, deleting, and color-cycling lines directly from the chart without opening settings panels or menus. Traders can organize support, resistance, liquidity zones, entries, stop losses, take profits, session highs/lows, or custom execution levels using multiple line colors.

A built-in persistent storage system automatically saves all lines locally, ensuring that your levels remain available even after restarting cTrader. Each symbol maintains its own independent synchronized levels, preventing chart clutter between instruments.

Designed for speed and efficiency, Sync Horizontal Lines is lightweight, responsive, and suitable for scalpers, day traders, swing traders, ICT traders, SMC traders, prop firm traders, and multi-monitor trading setups.

Main Features

  • Real-time synchronized horizontal levels across charts
  • Same-symbol multi-timeframe synchronization
  • Automatic local save/load persistence
  • Fast keyboard + mouse workflow
  • Multiple line color management
  • Lightweight and low resource usage
  • Instant level updating across charts
  • No manual re-drawing required
  • Professional workflow optimization


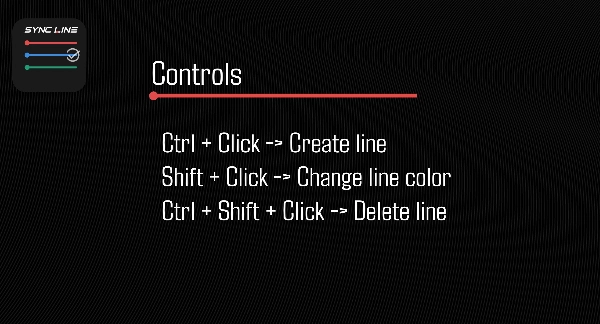
Controls

  • Ctrl + Click → Create line
  • Shift + Click → Change line color
  • Ctrl + Shift + Click → Delete line


Ideal For

  • Support & Resistance traders
  • ICT and SMC strategies
  • Scalping workflows
  • Intraday trading
  • Liquidity mapping
  • Session range marking
  • Multi-monitor setups
  • Professional chart management


Installation

Simply add the indicator to your Multicharts of different timeframe and start drawing using the keyboard shortcuts. No setup required.

The Indicator must be added to different charts to work properly.

สรุป

โปรไฟล์อินดิเคเตอร์
หมวดหมู่อินดิเคเตอร์
แนวรับและแนวต้าน
ประเภทเอาต์พุต
การแสดงเป็นภาพ
ข้อกำหนดด้านข้อมูล
แท่งเท่านั้น

การสนทนา

รีวิวจากลูกค้า

0.0
รีวิว: 0
รีวิวจากลูกค้า
ยังไม่มีรีวิวสำหรับผลิตภัณฑ์นี้ หากเคยลองแล้ว ขอเชิญมาเป็นคนแรกที่บอกคนอื่น!

คำถามที่พบบ่อย

Key Levels
Support & Resistance
ผลิตภัณฑ์ที่มีให้บริการผ่าน cTrader Store รวมถึงบอทการเทรด อินดิเคเตอร์ และปลั๊กอิน มีให้บริการโดยนักพัฒนาบุคคลที่สามและมีไว้เพื่อวัตถุประสงค์ในการเข้าถึงข้อมูลและทางเทคนิคเท่านั้น cTrader Store ไม่ใช่โบรกเกอร์และไม่ได้ให้คำแนะนำการลงทุน คำแนะนำส่วนบุคคล หรือการรับประกันผลการดำเนินงานในอนาคต

นอกจากนี้คุณยังอาจชอบ

"RangeBoxLevel" โลโก้
ยอดนิยม
4.7
(4)
$29
อินดิเคเตอร์
Grid
Prop
+5
This technical analysis indicator provides information on market sentiment, trend and price levels....
อินดิเคเตอร์
Forex
EURUSD
+7
Institutional Session Levels Pro OHLC,Prev(D,W,M OHLC)
อินดิเคเตอร์
AI
ATR
+26
The Triple Momentum indicator for cTrader is a versatile trend-following tool.
อินดิเคเตอร์
AI-assisted
Predictive Monte Carlo Engine Forecast future price paths using institutional-grade statistical models and probability
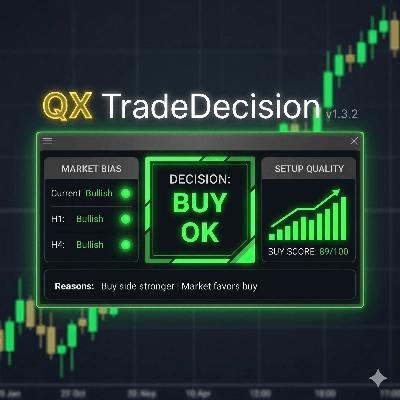
"QX TradeDecision" โลโก้
เรตติ้งสูง
4.5
(4)
$20
/
$22
อินดิเคเตอร์
ATR
Flag
+5
Decision panel with Buy/Sell scores, market bias, setup quality, trading cost and clear trade reasons.
อินดิเคเตอร์
Volume
Order Block
+3
Map market structure, order blocks, liquidity and key zones with an interactive cTrader dashboard.
อินดิเคเตอร์
Prop
Crypto
+5
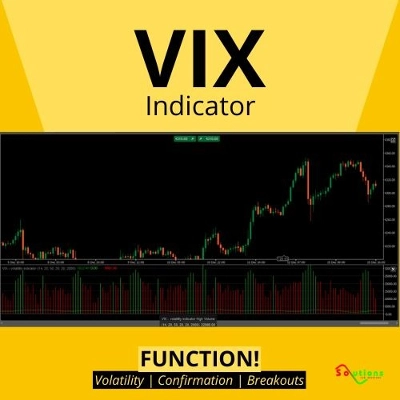
VIX Pro: Confirm Real Breakouts & Filter Market Noise with Volatility
อินดิเคเตอร์
RSI
MACD
+5
LudwigICT – Digital Root & IDR (cTrader Automate)
อินดิเคเตอร์
ATR
SMC
+20
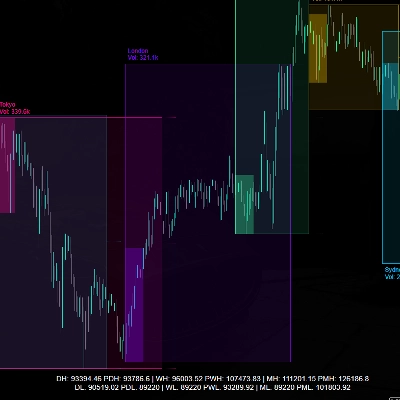
Session boxes, liquidity sweeps and higher‑timeframe levels for intraday trading
อินดิเคเตอร์
BOS
EMA
+5
VWAP Bands indicator with 3 standard deviation levels, buy/sell zones, and a draggable ON/OFF button to toggle the entir
อินดิเคเตอร์
BOS
CHOCH
+5
A professional-grade cTrader indicator for traders following the Inner Circle Trader (ICT) methodology.
อินดิเคเตอร์
Volume
Key Levels
View tick activity across a selected chart range with Point of Control, Value Area High and Value Area Low.
อินดิเคเตอร์
AI
SMC
+19
Fixed Range Volume Profile - TradingView Style (POC, VAH, VAL)
อินดิเคเตอร์
Volume
Key Levels
+5
Volume Profile Pro v2 - A Lightweight and Highly Customizable Side & Range Volume Profile
อินดิเคเตอร์
BOS
EMA
+5
Market structure signals graded A to C, each with a drawn trade plan, plus an adaptive trend ribbon and a trend matrix
"vwap" โลโก้
ยอดนิยม
4.8
(5)
$26
อินดิเคเตอร์
VWAP
Forex
+2
Custom VWAP Indicator for cTrader
อินดิเคเตอร์
AI
ATR
+27
The "Market Temperature" Moving Average -Turn Your MA Into a Live Market Temperature Line
อินดิเคเตอร์
Supertrend
Moving Average
Easy Trade: Trend & Breakout Indicator for cTrader

ราคา

ตั้งแต่ 06/04/2026