
الوصف
فقاعة ملف الحجم TPO — بواسطة The Quant
فقاعة ملف الحجم TPO هي مؤشر مميز لمنصة cTrader أنشأه The Quant.
هل تريد الانضمام إلينا؟ الروابط في السيرة الذاتية
━━━━━━━━━━━━━━━━━━━━━━
فقاعة ملف الحجم TPO
━━━━━━━━━━━━━━━━━━━━━━
فقاعة ملف الحجم TPO هي مؤشر كامل لقراءة السوق لمنصة cTrader.
يجمع هذا المؤشر بين أدوات قوية لقراءة السوق في مؤشر واحد نظيف:
◆ ملف الحجم
◆ مخطط الفقاعة
◆ TPO
◆ إشارات كسر وإعادة اختبار POC للروبوتات
تم تصميم هذه الأداة للمتداولين الذين يرغبون في قراءة مناطق الحجم بوضوح أكبر، وتحديد مستويات POC المهمة، واستخدام تلك المستويات داخل استراتيجيات يدوية أو آلية.
تم بناؤه لمنصة cTrader، مع الأخذ في الاعتبار كل من التحليل البصري وأتمتة cBot.
━━━━━━━━━━━━━━━━━━━━━━
ما الذي يفعله هذا المؤشر
━━━━━━━━━━━━━━━━━━━━━━
مناطق نشاط السوق
فقاعة ملف الحجم TPO تساعدك على تحديد المناطق التي كان السوق نشطًا فيها.
تسمى هذه المناطق POCs، أو نقاط السيطرة.
ال POC هو منطقة سعرية تركز فيها النشاط.
عندما يعود السعر إلى هذه المنطقة، قد يكسرها، يعيد اختبارها، يرفضها، أو يتفاعل منها.
الهدف الرئيسي
الهدف ليس التنبؤ بالسوق.
الهدف هو جعل مناطق السوق المهمة أسهل في الرؤية، أسهل في الفهم، وأسهل في الاستخدام في استراتيجية.
━━━━━━━━━━━━━━━━━━━━━━
الوضعيات البصرية الرئيسية
━━━━━━━━━━━━━━━━━━━━━━
◆ ملف الحجم
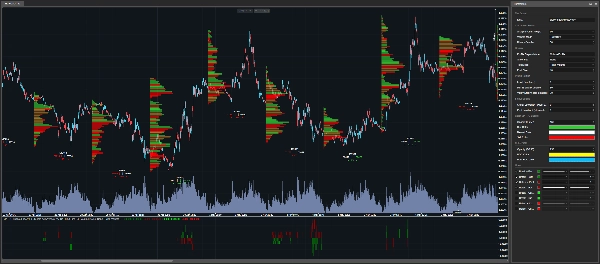
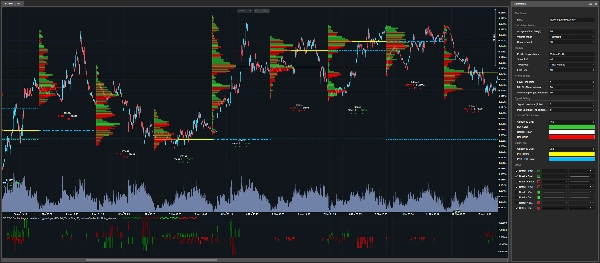
وضع ملف الحجم يعرض أشرطة حجم أفقية مباشرة على مخطط cTrader.
كلما كانت الشريط أكبر، كانت منطقة السعر أكثر أهمية خلال شمعة التحليل المختارة.
هذا الوضع مفيد عندما تريد رؤية الهيكل الكامل لتوزيع الحجم.
◆ مخطط الفقاعة
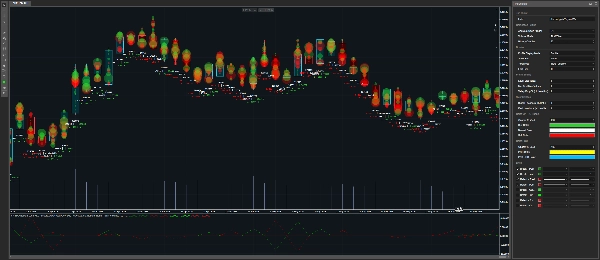
وضع مخطط الفقاعة يعرض مناطق الحجم المهمة كفقاعات.
كلما كانت الفقاعة أكبر، كانت المنطقة المكتشفة أكثر أهمية.
تم تصميم هذا الوضع من أجل القراءة البصرية السريعة.
يساعدك على تحديد المناطق الأكثر أهمية بسرعة على المخطط.
إذا كنت تريد استخدام المؤشر بشكل رئيسي كمخطط فقاعة، يمكنك ضبط عرض POC إلى لا شيء، ثم تعديل:
• الحد الأدنى % من الحجم الأقصى
• نسبة انخفاض الوادي
تتحكم هذه الإعدادات في عدد الفقاعات التي تريد رؤيتها.
القيم الأقل تعرض المزيد من الفقاعات.
القيم الأعلى تحتفظ فقط بـ أنظف المناطق.
◆ TPO
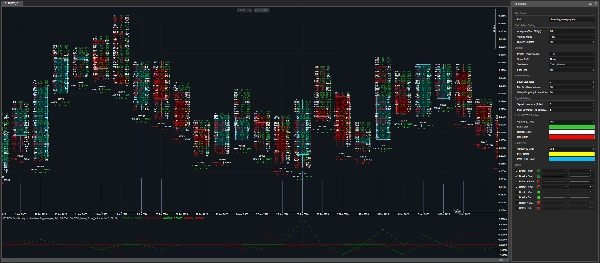
وضع TPO يعطي عرضًا أكثر تفصيلاً لما حدث داخل الشمعة.
يعرض:
• حجم الشراء
• حجم البيع
• الدلتا
• نشاط مستوى السعر
هذا الوضع مفيد عندما تريد فهم الهيكل الداخلي للمنطقة، وليس فقط رؤية مكان وجود الحجم.
━━━━━━━━━━━━━━━━━━━━━━
منطق التيك وحجم التيك
━━━━━━━━━━━━━━━━━━━━━━
سياق حجم العقود مقابل الفروقات
في العقود مقابل الفروقات، لا يتلقى المتداولون حجم تبادل مركزي كما هو الحال في أسواق العقود الآجلة.
بدلاً من ذلك، يعتمد الحجم على بيانات التيك من الوسيط.
يوفر هذا المؤشر وضعين لحساب الحجم:
• تيك
• حجم التيك
◆ تيك
يحسب كل تيك كوحدة واحدة.
هذا هو القراءة البسيطة لتدفق التيك الخاص بالوسيط.
◆ حجم التيك
يتم وزن التيكات حسب حجم حركة السعر.
التيك الذي يحرك السعر بمقدار 1 نقطة له وزن أكبر من التيك الذي يحرك السعر بمقدار 0.1 نقطة.
يمكن أن يساعد هذا في الكشف عن المناطق التي كان للحركة فيها تأثير أكبر، حتى لو لم يجعل عدد التيكات الخام المنطقة واضحة.
الفرق البسيط
التيك يحسب الأحداث.
حجم التيك يحسب الأحداث مع وزن الحركة.
━━━━━━━━━━━━━━━━━━━━━━
كشف نقاط السيطرة
━━━━━━━━━━━━━━━━━━━━━━
كيفية اكتشاف نقاط السيطرة
يكتشف المؤشر مناطق نقاط السيطرة باستخدام قمم الحجم ومنطق التصفية.
يجب أن تكون المنطقة قوية بما فيه الكفاية ومعزولة بما فيه الكفاية لتعتبر ذات صلة.
يساعد هذا في تجنب عرض كل منطقة صغيرة مزعجة على المخطط.
نقاط السيطرة الحالية والسابقة
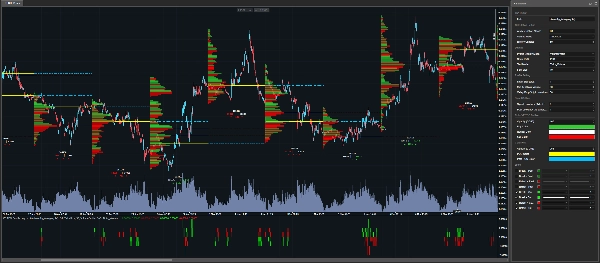
نقاط السيطرة الحالية يمكن عرضها مباشرة على المخطط.
يمكن أيضًا تمديدها إلى شمعة التحليل التالية باستخدام خطوط منقطة.
نقاط السيطرة السابقة يمكن أيضًا عرضها، مما يسمح للمتداولين بتتبع المستويات القديمة التي قد لا تزال مهمة.
━━━━━━━━━━━━━━━━━━━━━━
إشارات الكسر وإعادة الاختبار الجاهزة للروبوت
━━━━━━━━━━━━━━━━━━━━━━
مؤشر بصري وأداة أتمتة
فقاعة ملف الحجم TPO ليست مجرد مؤشر بصري.
كما يكشف عن سلاسل إخراج يمكن استخدامها داخل cBot أو روبوت تداول.
أنواع الإشارات المكتشفة
يمكن للمؤشر اكتشاف:
• كسر مستويات POC الحالية
• إعادة اختبار مستويات POC الحالية
• كسر مستويات POC السابقة
• إعادة اختبار مستويات POC السابقة
هذا يسمح للروبوت بالكشف عن متى يتفاعل السعر مع مناطق الحجم المهمة.
━━━━━━━━━━━━━━━━━━━━━━
درجات الإشارة
━━━━━━━━━━━━━━━━━━━━━━
ماذا تعني الدرجة
المؤشر لا يعيد فقط إشارة.
بل يعيد أيضًا درجة.
تخبر الدرجة الروبوت أي منطقة POC تم لمسها أو كسرها أو إعادة اختبارها.
منطق الدرجة
التصنيف يعتمد على سعر الافتتاح للشمعة التحليل المختارة.
الدرجات الإيجابية تمثل مناطق POC فوق سعر الافتتاح.
الدرجات السلبية تمثل مناطق POC تحت سعر الافتتاح.
أمثلة
• +1 = أول منطقة POC فوق سعر الافتتاح
• -1 = أول منطقة POC تحت سعر الافتتاح
• +2 = ثاني منطقة POC فوق سعر الافتتاح
• -3 = ثالث منطقة POC تحت سعر الافتتاح
كلما ابتعد الرقم عن الصفر، كلما كانت المنطقة أبعد عن سعر الافتتاح.
لماذا هذا مهم للأتمتة
هذا مفيد للأتمتة لأن الروبوت لا يعرف فقط أن إشارة حدثت.
بل يعرف أيضًا أين حدثت الإشارة.
━━━━━━━━━━━━━━━━━━━━━━
الإعدادات
━━━━━━━━━━━━━━━━━━━━━━
جميع الإعدادات منظمة حسب الفئة حتى تتمكن من فهم ما يتحكم به كل إعداد بسرعة.
━━━━━━━━━━━━━━━━━━━━━━
إعدادات الحساب
━━━━━━━━━━━━━━━━━━━━━━
◆ إطار زمني للتحليل
• يحدد الإطار الزمني المستخدم لبناء الملفات.
• هذا الإطار الزمني هو الأساس المستخدم لبناء الملفات، واكتشاف نقاط السيطرة، وتنظيم درجات الإشارة.
أمثلة:
• يومي = ملف واحد لكل يوم
• H4 = ملف واحد كل أربع ساعات
◆ وضع الحجم
• يختار كيفية حساب حجم التيك.
الأوضاع المتاحة:
• تيك = تيك واحد يساوي وحدة واحدة
• حجم التيك = التيكات موزونة حسب حجم حركة السعر
تيك هو الوضع البسيط.
حجم التيك يعطي أهمية أكبر للتيكات التي تحرك السعر بقوة أكبر.
◆ شموع التاريخ
• يحدد عدد الشموع السابقة من إطار التحليل الزمني المختار التي تبقى على المخطط.
• المزيد من الشموع يعطي سياقًا تاريخيًا أكثر.
• عدد أقل من الشموع يجعل المخطط أخف.
• قد يحتفظ المؤشر بهامش إضافي صغير داخليًا بحيث يتم حساب نقاط السيطرة، والكسر، وإعادة الاختبار بشكل صحيح.
━━━━━━━━━━━━━━━━━━━━━━
إعدادات العرض
━━━━━━━━━━━━━━━━━━━━━━
◆ وضع عرض الملف
• اختر ما يتم عرضه على المخطط:
• لا شيء
• ملف الحجم
• فقاعة
• TPO
لا شيء مفيد للأتمتة لأنه يزيل الرسومات من المخطط مع إبقاء مخرجات المؤشر متاحة.
هذا يسمح للمتداولين بالحفاظ على مخطط نظيف وما زالوا يستخدمون الإشارات داخل روبوت.
◆ عرض POC
• يتحكم في أي مستويات POC يتم عرضها.
الخيارات المتاحة:
• لا شيء = لا خطوط POC
• PoC = مستويات POC الحالية
• PoC Past = مستويات POC السابقة
• الكل = مستويات POC الحالية والسابقة
يمكن تمديد نقاط السيطرة الحالية إلى شمعة التحليل التالية باستخدام خطوط منقطة.
◆ وضع النص
• يتحكم في معلومات الحجم المعروضة تحت الشمعة.
الخيارات المتاحة:
• لا شيء = لا نص
• حجم التيكات = معلومات حجم التيك
• نسبة الدلتا = الاختلال معروض كنسبة مئوية
للأتمتة، يمكن ضبط هذا على لا شيء للحفاظ على نظافة المخطط.
◆ حجم الخط
• يتحكم في حجم النص المعروض.
• زِد الحجم لتحسين قابلية القراءة.
• قلل الحجم إذا كان المخطط مزدحمًا جدًا.
━━━━━━━━━━━━━━━━━━━━━━
إعدادات الملف
━━━━━━━━━━━━━━━━━━━━━━
◆ حجم المستوى
• يتحكم في حجم كل مستوى سعري.
• القيم الأصغر تعطي تفاصيل أكثر.
• القيم الأكبر تخلق ملف أنظف وأخف.
• يتضمن المؤشر آلية أمان لتجنب إنشاء الكثير من عناصر المخطط.
إذا أوصى رسالة بزيادة حجم المستوى، فهذا يعني أن المؤشر يحمي المخطط من التحميل الزائد غير الضروري.
في هذه الحالة، يتم تطبيق مستوى أدنى آمن داخليًا بالفعل.
◆ الحد الأدنى % من الحجم الأقصى
• يفلتر المناطق بناءً على قوتها.
• يجد المؤشر أولاً أقوى منطقة حجم داخل الشمعة.
• ثم يحتفظ فقط بالمناطق التي تصل على الأقل إلى النسبة المئوية المختارة من تلك المنطقة القصوى.
مثال:
• إذا تم ضبط الحد الأدنى % من الحجم الأقصى على 80%، يمكن اختيار المناطق التي تحتوي على الأقل على 80% من أعلى منطقة حجم.
القيم الأقل تعرض مناطق أكثر.
القيم الأعلى تعرض مناطق أقل ولكن أقوى.
الحد الأدنى % من الحجم الأقصى هو فلتر القوة.
◆ نسبة انخفاض الوادي
• يتحقق مما إذا كانت نقطة السيطرة معزولة بوضوح.
• فكر في نقطة السيطرة كقمة جبل.
• لتأكيد أنها قمة حقيقية، يتحقق المؤشر مما إذا كان الحجم ينخفض بما فيه الكفاية حولها.
القيم الأقل تقبل مناطق أكثر.
القيم الأعلى تحتفظ فقط بـ مناطق أنظف وأكثر انفصالًا.
نسبة انخفاض الوادي هي فلتر العزل.
━━━━━━━━━━━━━━━━━━━━━━
إعدادات الإشارة
━━━━━━━━━━━━━━━━━━━━━━
◆ نظرة خلفية للإشارة
• يختار أي شمعة مغلقة توفر نقاط السيطرة المستخدمة لإشارات الكسر وإعادة الاختبار الحالية.
القيم المتاحة:
• 0 = آخر شمعة مغلقة
• 1 = الشمعة قبل آخر شمعة مغلقة
• 2 = أبعد من ذلك
يسمح هذا للمتداولين باختبار الإشارات بناءً على مراجع POC الأحدث أو الأقدم.
◆ نظرة خلفية للماضي
• يحدد عدد الشموع الأقدم التي يتم مسحها لبناء مستويات POC السابقة.
• قيمة أعلى تسمح للمؤشر بالبحث عن مناطق POC الأقدم التي قد لا تزال مهمة.
━━━━━━━━━━━━━━━━━━━━━━
إعدادات الألوان
━━━━━━━━━━━━━━━━━━━━━━
◆ ألوان الملف
تخصص هذه الإعدادات ألوان الملف البصري:
• لون الشراء
• لون البيع
• لون محايد
• شفافية الملف
تتحكم هذه الإعدادات في مظهر ملف الحجم، مخطط الفقاعة، وTPO.
◆ ألوان POC
تخصص هذه الإعدادات ألوان مستويات POC الحالية والسابقة:
• لون POC
• لون POC السابق
• شفافية POC
استخدام ألوان مختلفة لـ نقاط السيطرة الحالية ونقاط السيطرة السابقة يجعل المخطط أسهل في القراءة.
━━━━━━━━━━━━━━━━━━━━━━
لمن هذا المؤشر؟
━━━━━━━━━━━━━━━━━━━━━━
تم تصميم هذا المؤشر لـ:
◆ مستخدمي cTrader
◆ متداولي ملف الحجم
◆ متداولي TPO
◆ مستخدمي مخطط الفقاعة
◆ متداولي POC
◆ المتداولين الخوارزميين
◆ مطورين cBot
◆ المتداولين الذين يريدون أدوات بصرية ومخرجات جاهزة للروبوت
◆ المتداولين الذين يريدون اختبار منطق الكسر وإعادة الاختبار حول مناطق الحجم
━━━━━━━━━━━━━━━━━━━━━━
ملاحظة مهمة
━━━━━━━━━━━━━━━━━━━━━━
هذا المؤشر ليس زرًا سحريًا.
إنه لا يتنبأ بالسوق.
يساعد المتداولين على تحديد مناطق السوق المهمة، ومراقبة ردود فعل السعر، وبناء استراتيجيات يمكن اختبارها، وتحسينها، وأتمتتها.
اختبر استراتيجيتك دائمًا قبل استخدامها في التداول الحي.
━━━━━━━━━━━━━━━━━━━━━━
The Quant
━━━━━━━━━━━━━━━━━━━━━━
The Quant هو مشروع تداول وتداول خوارزمي يركز على:
◆ البيانات
◆ الأتمتة
◆ الاختبار الخلفي
◆ التحسين
◆ مكافحة الإفراط في التوفيق
الهدف هو مساعدة المتداولين على الانتقال من الأفكار إلى استراتيجيات قابلة للاختبار، ومُنظمة، وقابلة للأتمتة.
The Quant، للمؤمنين بالبيانات.
الملخص
Designed for both manual traders and algorithmic developers, it supports cBot automation by providing break and retest signals of current and past POC levels, along with scoring to indicate the relative position of these zones to the candle open price. This facilitates the creation and testing of volume-based trading strategies.
Volume calculation can be set to simple tick counts or weighted by price movement size (TickXSize), enhancing the detection of impactful volume zones, especially in CFD markets where volume data is broker-dependent. The indicator offers customizable display modes, filtering parameters for volume zone strength and isolation, and color settings for clarity.
Intended for cTrader users interested in volume profile, TPO, bubble chart visualization, and automated trading strategies, it aids in identifying significant volume zones and price reactions without predicting market direction.
تقييمات العملاء
5 | 100 % | |
4 | 0 % | |
3 | 0 % | |
2 | 0 % | |
1 | 0 % |