
Confluence PRO
Indicator
Version 1.0, Oct 2026
Windows, Mac
4.2
Reviews: 4
Since 03/10/2024
181
Sales
46.02K
Free installs
Description
Pulse Grid Confluence is an advanced analytical HUD (Heads-Up Display) and backtesting tool designed for cTrader. It aggregates multiple technical indicators into a clean, on-chart visual panel, allowing traders to confirm trend alignment and evaluate historical setup performance in real time without cluttering their charts. ⚡
🔍 What Market Data & Conditions it Analyses
The indicator continuously monitors price action, trend direction, momentum, and volatility across up to 11 technical modules:
- 📈 Trend & Moving Averages: SMA Cross, EMA Cross, Supertrend, Bollinger Bands mid-line, and Parabolic SAR.
- 🚀 Momentum & Oscillators: RSI, MACD, Stochastic Oscillator, CCI, and Awesome Oscillator.
- 🛡️ Filter & Volatility: ADX Gate with Directional Movement (+DI/-DI) and ATR-based risk levels.
🖥️ How to Interpret Signals & Visual Elements
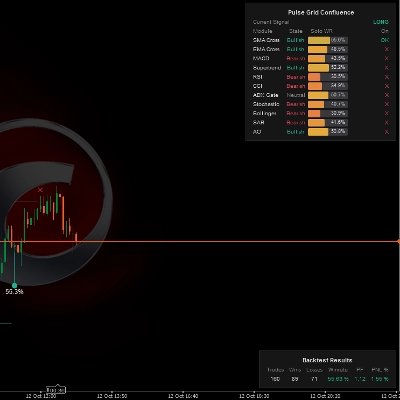
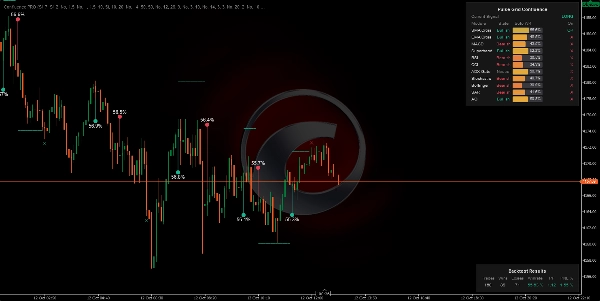
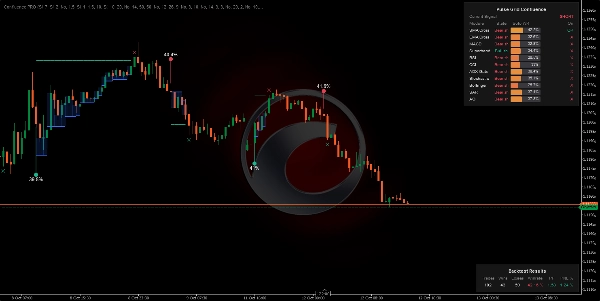
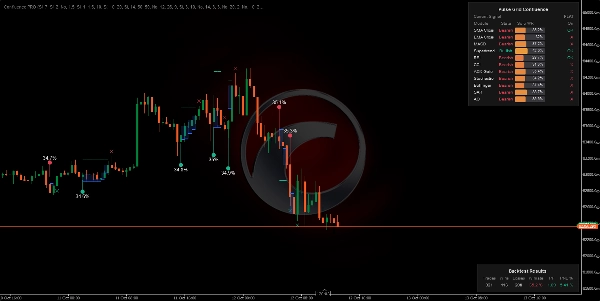
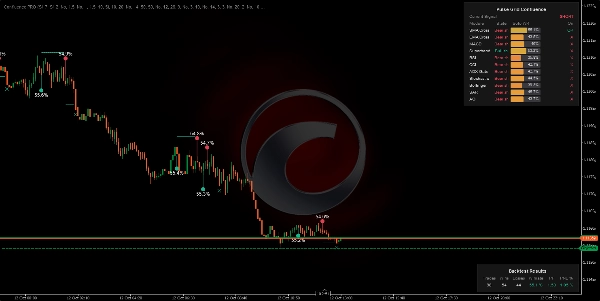
- 🚥 Current Signal Header: Displays LONG 🟩, SHORT 🟥, or FLAT ⬜ based on active confluence conditions.
- 📊 Module Grid: Shows each active indicator's current bias (Bullish / Bearish / Neutral), module status (OK / X), and its individual standalone Win Rate ("Solo WR") in a color-coded visual progress bar.
- 🎯 Chart Markers: Displays entry points with win rate percentages at entry, signal exit icons (✕), and ATR-based target, protective stop, and trailing stop lines with dynamic shading.
- 🏆 Backtest Results Panel: Real-time stats box showing total Trades, Wins, Losses, overall Winrate %, Profit Factor (PF), and Net PNL % directly on chart.
⚙️ Key Settings & Parameters
- 🎛️ Signal Logic: Option to require strict full confluence across all enabled modules or flexible mode.
- 📐 Risk Engine: Configurable ATR multipliers for Take Profit ($TP$), Protective Stop ($SL$), and Trailing Stop ($TS$).
- 🧩 Module Selectors: Toggle any of the 11 analytical modules on/off and adjust their individual periods/thresholds.
- 🎨 Visual HUD Customization: Control panel anchors, scaling options (Micro to Giant), and marker offsets.
💡 Typical Use Cases & Trading Scenarios
- 🛑 Trend Confirmation: Filter out false breakouts by requiring momentum and trend indicators to align before entering.
- 📊 Strategy Auditing: Compare individual module accuracy ("Solo WR") against total confluence to identify which indicators perform best in the current market environment.
- 🎯 Dynamic Risk Management: Set ATR-based exit levels visually to adapt stop-losses to current market volatility.
👥 Who This Indicator is Best Suited For
- 🧠 Systematic & Rule-Based Traders: Ideal for traders who want objective confirmation before placing orders.
- 📈 Multi-Indicator Strategy Users: Perfect for anyone who relies on multiple indicators but wants a clean, organized chart interface.
- 🛠️ Intermediate to Advanced Traders: Highly customizable for developers or experienced traders testing confluence rules.
⚠️ Important Limitations & Usage Notes
- 🤖 Not an Automated Bot: This is a visual analytical indicator (HUD); trades must be placed manually unless integrated into an automated cBot.
- 📜 Backtest Scope: The on-chart performance panel reflects historical bars loaded on the active chart view.
- 📊 Parameter Tuning: Win rates and signal frequencies will vary based on timeframe, market conditions, and chosen indicator parameters.
Summary
AI summary
Confluence PRO is a multi-indicator analytical HUD and real-time backtesting tool designed for cTrader. It consolidates up to 11 technical modules—including trend and moving averages (SMA Cross, EMA Cross, Supertrend, Bollinger Bands mid-line, Parabolic SAR), momentum and oscillators (RSI, MACD, Stochastic, CCI, Awesome Oscillator), and volatility filters (ADX with Directional Movement, ATR-based risk levels)—into a streamlined on-chart display. The indicator continuously monitors price action, trend direction, momentum, and volatility to detect trend alignment and filter high-probability trading setups.
Key visual elements include a current signal header showing LONG, SHORT, or FLAT bias; a module grid displaying each indicator’s bias, status, and standalone win rate; chart markers for entry points, exits, and ATR-based targets/stops; and a backtest results panel with real-time statistics such as total trades, wins, losses, win rate, profit factor, and net PNL percentage.
Users can customize signal logic (strict or flexible confluence), ATR multipliers for take profit and stops, toggle modules on/off, and adjust visual HUD settings. Typical use cases involve trend confirmation, strategy auditing by comparing module accuracy, and dynamic risk management. The tool is suited for systematic, multi-indicator, and intermediate to advanced traders seeking objective, rule-based trade confirmation and performance evaluation. Trades are placed manually; this is a visual analytical indicator, not an automated bot.
Key visual elements include a current signal header showing LONG, SHORT, or FLAT bias; a module grid displaying each indicator’s bias, status, and standalone win rate; chart markers for entry points, exits, and ATR-based targets/stops; and a backtest results panel with real-time statistics such as total trades, wins, losses, win rate, profit factor, and net PNL percentage.
Users can customize signal logic (strict or flexible confluence), ATR multipliers for take profit and stops, toggle modules on/off, and adjust visual HUD settings. Typical use cases involve trend confirmation, strategy auditing by comparing module accuracy, and dynamic risk management. The tool is suited for systematic, multi-indicator, and intermediate to advanced traders seeking objective, rule-based trade confirmation and performance evaluation. Trades are placed manually; this is a visual analytical indicator, not an automated bot.
Indicator profile
Indicator category
Trend
Output type
Visualisation
Signals
Filter
Data requirements
Bars only
Supported signals
Cross
Breakout
Volatility
Trend strength
Discussion
Customer reviews
4.2
Reviews: 4
5 | 25 % | |
4 | 75 % | |
3 | 0 % | |
2 | 0 % | |
1 | 0 % |
Customer reviews
October 30, 2026
Inspecting module statistics beside the simulated exit configuration gives Long, Short and Flat useful analytical context, rather than presenting those outputs as actual account positions.
October 28, 2026
Comparing the 11 technical components individually instead of hiding them behind one Long or Short label is an excellent detail, with simulated stops and targets exposing the assumptions behind the final direction.
October 24, 2026
individual statistics for up to 11 modules and explicit simulated exits make the Long, Short or Flat output fairly inspectable, with displayed win rates remaining dependent on those assumptions rather than representing a live account.
October 15, 2026
module statistics and simulated exits make the 11 component display useful for comparing configurations. Changing stops and targets changes the basis of its win rate, which remains a model result rather than a live account history.
FAQ
ADX
Bollinger Bands
Supertrend
SMA
Key Levels
RSI
ATR
Products available through cTrader Store, including trading bots, indicators and plugins, are provided by third-party developers and made available for informational and technical access purposes only. cTrader Store is not a broker and does not provide investment advice, personal recommendations or any guarantee of future performance.




Price
Since 03/10/2024
181
Sales
46.02K
Free installs