Brokers & props
For business
00
Days
:
00
Hours
:
00
Minutes
:
00
Seconds
Indicator
NAS100
NZDUSD
Martingale
Forex
Fibonacci
EURUSD
MACD
BTCUSD
SMC
Indices
ATR
Stocks
Grid
RSI
Breakout
XAUUSD
FVG
Commodities
Signal
Bollinger
GBPUSD
AI
VWAP
ZigZag
Prop
Supertrend
Crypto
USDJPY
Scalping
FIBONACCI Volume Delta Indicator
07/01/2026
30
Desktop
Since 04/03/2025
Traded volume
37.16M
Pips won
6.03M
Sales
50
Free installs
2814
"FIBONACCI Volume Delta Indicator" uploaded image"FIBONACCI Volume Delta Indicator" uploaded image

📊 Fib Volume Delta Indicator (FREE)

Fibonacci, Projection & Real Volume Delta for cTrader

🆓 Fib Volume Delta Indicator is a free professional indicator for cTrader, designed to help traders analyze Fibonacci retracements, market structure, and real volume delta in a clean and intuitive way.

This indicator is the foundation of the Fib Volume Delta Bot, providing the same logic in a manual, visual form.

📌 For the Indicator (Manual Analysis)

Related Tool Notice
This indicator is the analytical foundation of the Fib Volume Delta Bot, an automated trading solution built on the same Fibonacci and volume delta logic.

While the indicator is designed for manual analysis and decision support, the cBot transforms this logic into a fully automated strategy with advanced risk and trade management. https://ctrader.com/it/products//3006/?u=Labot

🔍 WHAT THE INDICATOR DOES

The indicator automatically:

✅ Detects swing high & swing low
✅ Draws key Fibonacci levels
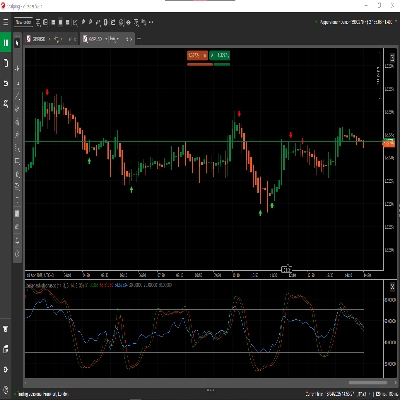
✅ Calculates real volume delta (bull vs bear tick volume)
✅ Projects potential price targets using Fibonacci projection
✅ Works on Forex, Crypto, Indices

No repaint.
No simulated volume.
No clutter.


🧮 CORE FEATURES

📐 Fibonacci Structure

  • Automatic detection of the current price range
  • Fibonacci levels drawn dynamically:
    • 23.6%
    • 38.2%
    • 50.0%
    • 61.8%
    • 78.6%
  • Bullish or bearish logic based on swing order


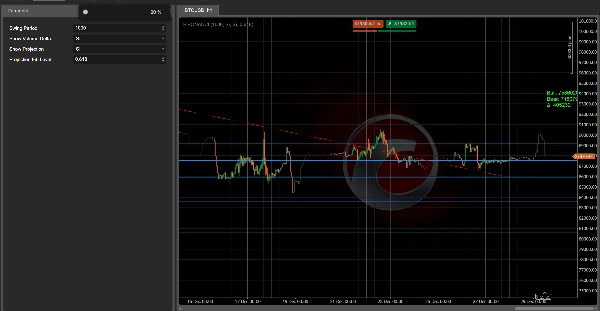
🔮 Fibonacci Projection

  • Optional projection line to estimate future price targets
  • Uses the same swing range
  • Ideal for:
    • take profit planning
    • risk/reward evaluation
    • scenario analysis


📊 Real Volume Delta

  • Calculates bullish vs bearish tick volume
  • Displays:
    • Bull volume
    • Bear volume
    • Delta (Bull − Bear)
  • Helps identify:
    • absorption
    • divergence
    • strength or weakness behind moves

⚠️ Uses real tick volume, not simulated data.


⚙️ PARAMETER EXPLANATION

🧭 Swing Detection

  • 🔢 Swing Period
    • Number of bars used to detect the swing high and swing low
    • Higher value = more stable structure
    • Lower value = more reactive structure


📊 Volume Delta

  • 👁 Show Volume Delta
    • Enable / disable the volume delta text on chart


🔮 Projection

  • 📈 Show Projection
    • Enable / disable Fibonacci projection
  • 📐 Projection Fib Level
    • Fibonacci extension used for projection (e.g. 0.618, 1.0, 1.618)


🧠 HOW TO USE IT

✔ Identify key retracement zones
✔ Confirm entries with volume delta
✔ Project realistic targets
✔ Combine with price action or trend filters
✔ Perfect for manual trading or semi-automated workflows


🤖 INDICATOR + BOT WORKFLOW

This indicator is the visual and analytical base of the Fib Volume Delta Bot:

  • 📊 Indicator → analysis & confirmation
  • ⚙️ cBot → execution, risk management & automation

You can:

  • use the indicator alone (manual trading)
  • or pair it with the cBot for full automation


🆓 FREE & TRANSPARENT

✔ Completely FREE
✔ No locked features
✔ No external dependencies
✔ Designed for professional traders


⚠️ DISCLAIMER

This indicator does not generate signals by itself.
It is a decision-support tool, meant to be used with proper risk management and market context.

0.0
Reviews: 0
Customer reviews
No reviews for this product yet. Already tried it? Be the first to tell others!
More from this author
Indicator
NAS100
NZDUSD
Martingale
+26
Volume Delta
Read aggressive flow in real time. Flexible resets (Day/Week/Month), optional EMA smoothing, and non-repainting cumulati
cBot
Grid
NAS100
RSI
+20
Breakout Premium Pro v2.0
A price-action-first algorithm to trade Breakout, Approach, and Return around prior High/Low levels—with Prop-style risk
Indicator
Grid
NZDUSD
XAUUSD
+16
vWAP Free
Editions: Free (core VWAP + bands) · Pro (multi‑VWAP, click‑to‑anchor, alerts).
cBot
NAS100
NZDUSD
Martingale
+26
Prop Ready Bot_v.2.0
The Prop-Ready Bot The Definitive Automaton for Challenges 🛡️ V2.0
cBot
NAS100
NZDUSD
Martingale
+26
ElliottWaveBot
N.B.: Results with an initial invested capital of 100 euros.
cBot
NAS100
NZDUSD
Martingale
+26
ElliottWave Pro cBot
The Elliott Wave Pro Bot is a sophisticated and highly configurable algorithmic trading system
Indicator
NAS100
NZDUSD
Martingale
+26
Breakout channel
Breakout Channels automatically detects consolidation ranges and highlights when price breaks out of them.
cBot
Indices
RSI
Forex
+2
US 2000+MACD+ADR+ADMIR+RSI+MANY MORE-TF4M
N.B.: Results with an initial invested capital of 100 euros.
Indicator
NAS100
NZDUSD
Martingale
+26
Volume Bubble
Volume Bubbles is a lightweight yet powerful visual indicator for cTrader
cBot
NAS100
NZDUSD
Martingale
+26
Dynamic Trendline Deluxe Pro Cbot - PROP edition
Major Update Announcement: Advanced Prop Firm Risk Management is Here! 🚀
Indicator
NAS100
NZDUSD
XAUUSD
+14
ZIG ZAG Free
ZigZag Free is a clean swing-detection tool that marks significant pivot highs/lows
Indicator
ZigZag
Indices
Breakout
+1
Auto Tools Suite
Auto Trendlines, Fibonacci, Pitchfork and Patterns from non‑repainting pivots. One‑click Presets, targeted Alerts, and a
Indicator
Grid
NAS100
NZDUSD
+15
EMA UP&DOWN 2025
SectorIndex Dual Moving Average Indicator: Your Market Compass 🧭
cBot
NAS100
Indices
XAUUSD
+7
COT Institutional Sentiment Bot
Institutional COT sentiment, automated position trading and full prop-firm style risk control – all in one cBot.
Indicator
NAS100
NZDUSD
Martingale
+25
Volume Profile Suite trial7D
DEMO VERSION 7 DAYS VolumeProfileSuite is an advanced and flexible Volume Profile indicator for cTrader.
cBot
Indices
ATR
US500 LONG&SHORT TF 5M ALL SEASON!
🚀N.B.: Results with an initial invested capital of 100 euros.
Indicator
NAS100
NZDUSD
Martingale
+26
Liquidity Shift Indicator
Want a cBot based on this indicator? Contact us!
cBot
NAS100
NZDUSD
Martingale
+26
TradeCopierBot
✅ Buy 3 prop accounts and manage just 1: cut management effort by 66% with a professional tool.
You may also like
Indicator
NAS100
Indices
XAUUSD
+8
HIGHS LOWS AEGIS
PDL/PDH/PWL/PWH and Session higs/lows (customizable)
Indicator
NAS100
RSI
NZDUSD
+12
TrendMomentumScore
TrendMomentumScore_558: all-in-one EMA, MACD & RSI trend strength meter with clear -100 to +100 buy/sell zones.
Indicator
NAS100
NZDUSD
Martingale
+23
Elliott Waves Auto Detection + Fibonacci
Auto-detect Elliott 1–5 & a–b–c waves with smart Fib zones, boxed labels, and breakout boxes—ready to trade.
Indicator
Indices
Breakout
Commodities
+3
Daily Levels
The "Daily Levels" indicator is used to display last week's and yestoday high/low price
Indicator
RSI
Breakout
XAUUSD
+4
Dynamic Market Structure Analysis of Turning Points
Identify market structure effortlessly with swing highs, lows, CHoCH, and BOS levels for smart trading decisions! 📊🔍"
Indicator
Grid
NAS100
NZDUSD
+15
EMA UP&DOWN 2025
SectorIndex Dual Moving Average Indicator: Your Market Compass 🧭
Indicator
Breakout
XAUUSD
Forex
+2
McDonalds Pattern-Bzier Curve
Designed to identify and visualize price reversal patterns using Bézier curves.
Donchian Flux Cloud
Trend-coloring Donchian cloud that highlights volatility squeezes and breakouts.
Supertrend TV
REAL Supertrend because default Ctrader Supertrend gives different signals
Indicator
Indices
Forex
EURUSD
+1
DXY w HMA
DXY HMA Indicator
VegaXLR - RSI and StochRSI Alerts
VegaXLR's cTrader StochRSI identifies overbought/oversold RSI levels for precise trade entries.
Top-rated
Free
BarSentiments
This Indicator is a technical analysis tool that measures the strength and direction of market sentiment
Indicator
Indices
RSI
Breakout
+6
ZigZagColor
The ZigZag indicator is a technical analysis tool primarily used to identify key price reversal points.
IR Multi Data
show symbol and time fram, daily net profit percent, daily net profit, and spread ln your chart. consider that timezone
Indicator
Breakout
ATR
Signal
[Stellar Strategies] Market Structure Breakout
Flags breakouts of recent highs/lows on cTrader charts. Shows arrows/lines. Optional trend filter & sound alerts 📉📈
xhobaniFX_ADR-Lines
xhobaniFX_ADR-Lines: Average Daily Range Horizontal Lines
Indicator
RSI
Breakout
ATR
+2
Channel Breakout System
🚀 Specialized algorithm is designed to confirm entry and exit points with precision 🎯
Anchored VWAP Buttons