
Descrizione
Cos'è LTtradingBox?
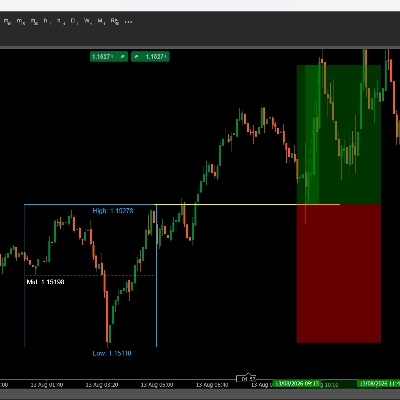
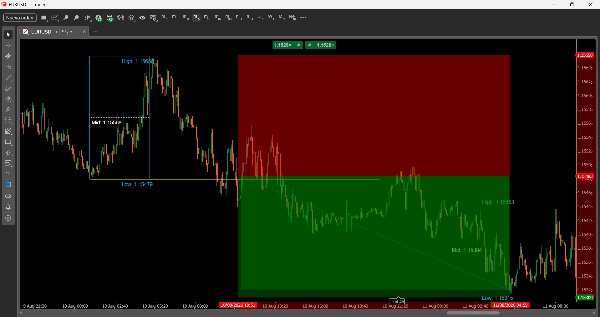
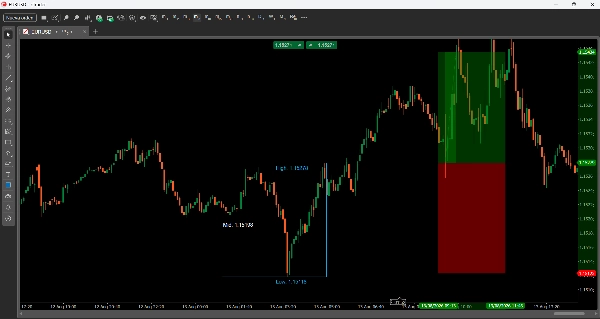
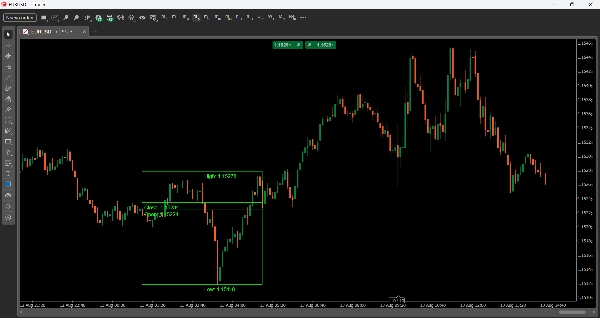
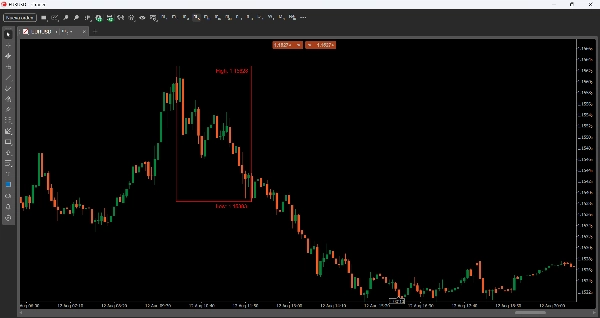
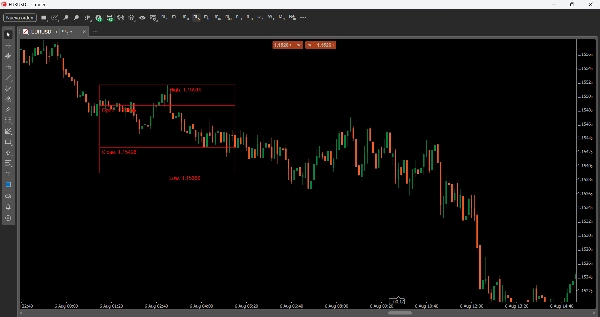
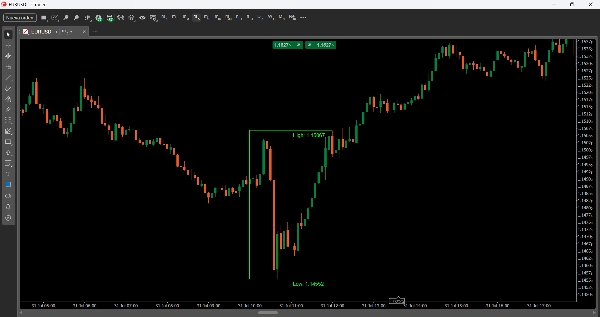
LTtradingBox evidenzia visivamente l'intervallo di prezzo (massimo, minimo, apertura e chiusura) di una finestra temporale che definisci — per esempio la sessione di Londra o New York. La casella cambia automaticamente colore in base all'esito di quella sessione: verde se ha chiuso in rialzo, rosso se ha chiuso in ribasso, grigio se neutro (o qualunque colore tu scelga per ogni caso). Aggiunge anche linee di riferimento (Prezzo Medio, Tempo Medio) e un riempimento visivo opzionale, aiutandoti a individuare zone di liquidità, intervalli di accumulo e livelli chiave per operare a colpo d'occhio.
Parametri
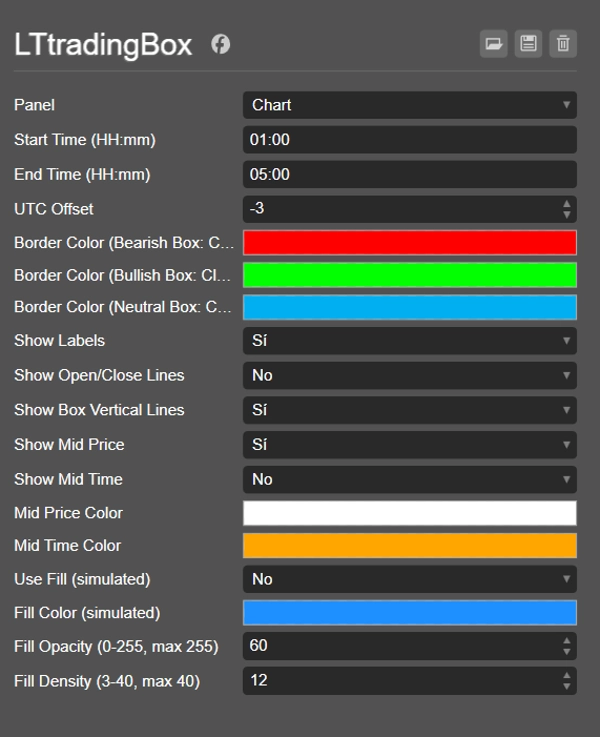
Impostazioni Temporali
- Ora di Inizio (HH:mm) — Ora di inizio della casella (formato 24 ore).
- Ora di Fine (HH:mm) — Ora di fine della casella.
- Offset UTC — Regolazione dell'ora affinché la casella si allinei con il tuo orario locale o con la sessione che vuoi monitorare (es. Londra, NY, Asia), indipendentemente dal fuso orario del tuo broker.
Colori
- Colore Bordo (Casella Ribassista: Chiusura < Apertura) — Colore del bordo quando la casella chiude in ribasso.
- Colore Bordo (Casella Rialzista: Chiusura > Apertura) — Colore del bordo quando la casella chiude in rialzo.
- Colore Bordo (Casella Neutra: Chiusura == Apertura) — Colore del bordo quando chiusura e apertura sono uguali.
Opzioni di Visualizzazione
- Mostra Etichette — Attiva/disattiva le etichette testuali che mostrano i valori di Massimo, Minimo, Apertura e Chiusura.
- Mostra Linee di Apertura/Chiusura — Disegna linee orizzontali che segnano il prezzo di apertura e chiusura all'interno della casella.
- Mostra Linee Verticali della Casella — Abilita il rettangolo completo (4 bordi); se disabilitato, vengono mostrate solo le linee di Massimo e Minimo.
- Mostra Prezzo Medio — Disegna una linea tratteggiata al punto medio tra Massimo e Minimo.
- Mostra Tempo Medio — Disegna una linea verticale al punto medio temporale della casella.
- Colore Prezzo Medio / Colore Tempo Medio — Colori personalizzabili per queste linee.
Riempimento (riempimento visivo)
- Usa Riempimento (simulato) — Abilita un riempimento simulato all'interno della casella (usando linee sottili sovrapposte).
- Colore Riempimento (simulato) — Colore del riempimento.
- Opacità Riempimento (0-255, max 255) — Livello di trasparenza del riempimento.
- Densità Riempimento (3-40, max 40) — Numero di linee usate per simulare il riempimento (densità maggiore = riempimento più solido).
Idee di Trading
- Rottura e retest: aspetta che il prezzo superi il Massimo o il Minimo della casella, poi ritorni a testare quel livello come supporto/resistenza prima di entrare nella direzione della rottura.
- Inversione agli estremi: se il prezzo tocca il Massimo o il Minimo della casella senza superarlo con forza, può segnalare un rifiuto e un movimento verso il lato opposto della casella.
- Bias direzionale per sessione: il colore della casella ti dà un bias rapido (rialzista/ribassista/neutro) su come si è mossa quella sessione, utile per allineare gli ingressi nelle sessioni successive.
- Prezzo Medio come calamita: il punto medio spesso agisce come zona di riequilibrio — cerca ingressi quando il prezzo ritorna al Medio dopo un forte movimento impulsivo.
- Confronta caselle consecutive: poiché ogni casella giornaliera viene salvata (tramite il suo tag data), puoi confrontare l'intervallo e il bias di diverse sessioni consecutive per individuare trend a breve termine.
Riepilogo
Riepilogo AI
LTtradingBox is a customizable trading indicator that visually highlights the price range—high, low, open, and close—within any user-defined time window, such as a specific trading session. The indicator draws a colored box representing this range, automatically changing its border color to green for bullish closes, red for bearish closes, or gray for neutral, with customizable color options. It includes reference lines for the midpoint price and midpoint time, which can be displayed as dotted or vertical lines, aiding in identifying liquidity zones, accumulation areas, and key support/resistance levels.
Users can configure start and end times, apply a UTC offset to align with local or session times, and toggle display options such as labels for price points, open/close lines, full box borders, and visual fills with adjustable color, opacity, and density. The indicator supports trading strategies including breakout and retest of box boundaries, reversal signals at extremes, session-based directional bias, and using the midpoint as a rebalancing zone. It also allows comparison of consecutive session boxes to detect short-term trends. LTtradingBox is designed to assist traders in quickly identifying key levels and market structure within chosen timeframes.
Users can configure start and end times, apply a UTC offset to align with local or session times, and toggle display options such as labels for price points, open/close lines, full box borders, and visual fills with adjustable color, opacity, and density. The indicator supports trading strategies including breakout and retest of box boundaries, reversal signals at extremes, session-based directional bias, and using the midpoint as a rebalancing zone. It also allows comparison of consecutive session boxes to detect short-term trends. LTtradingBox is designed to assist traders in quickly identifying key levels and market structure within chosen timeframes.
Profilo indicatore
Categoria indicatore
Supporto e resistenza
Tipo di output
Visualizzazione
Requisiti per i dati
Solo barre
Segnali supportati
Rottura
Inversione
Livello rotto
Livello raggiunto
Recensioni dei clienti
0.0
Recensioni: 0
Recensioni dei clienti
Questo prodotto non ha ancora ricevuto recensioni. L'hai già provato? Fallo sapere agli altri per primo!
Discussioni
Domande frequenti
Key Levels
Support & Resistance
I prodotti disponibili tramite cTrader Store, inclusi bot di trading, indicatori e plugin, sono forniti da sviluppatori terzi e resi disponibili esclusivamente a scopo informativo e di accesso tecnico. cTrader Store non è un broker e non fornisce consulenze in materia di investimento, raccomandazioni individualizzate o garanzie di risultati futuri.













![Logo di "Gaussian Channel [Iridio Capital]"](https://cdn.ctrader.com/image/webp/2c4f9ca9-4e9b-476d-b5a6-787c8095032b_61546)




Prezzo
Da 10/01/2025