Açıklama
Hangi piyasa verilerini analiz eder
London Open Signal, bağlı sembolün yıllarca süren gün içi geçmişini doğrudan brokerinizden (M15 veya H1 çözünürlük, sizin seçiminiz) yükler ve her geçmiş işlem gününü iki pencereye yeniden oluşturur: tam bir "gün" aralığı (başlangıç/bitiş saati yapılandırılabilir) ve Londra seansı (broker sunucu saatine göre açılış/kapanış saati yapılandırılabilir). Her tarihsel seans için sabit bir stop ve hedef kullanarak iki varsayımsal işlem simüle eder — uzun ve kısa — ve eğer hiçbiri tetiklenmezse seans kapanışında çıkar, spread ve maliyetler için bir pay düşülerek. Daha sonra bu sonuçlara karşı beş basit fikri test eder, hangisinin, eğer varsa, sonucu gerçekten tahmin ettiğini görmek için: mevcut gece boyunca kazanma/kaybetme serisi, haftanın günü, seans açılış fiyatının önceki günün aralığında nerede olduğu, önceki günün kapanışına göre boşluk ve önceki günün aralığının olağan dışı geniş veya dar olup olmadığı.
Sinyalleri ve görsel öğeleri nasıl yorumlamalı
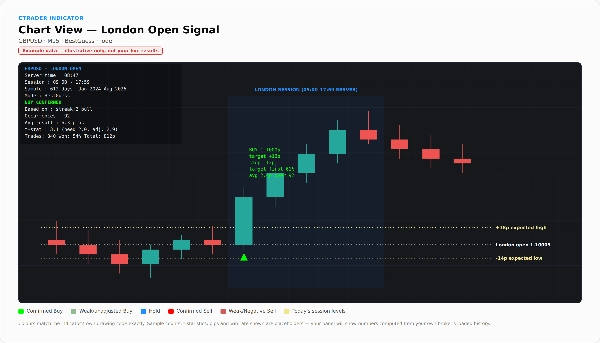
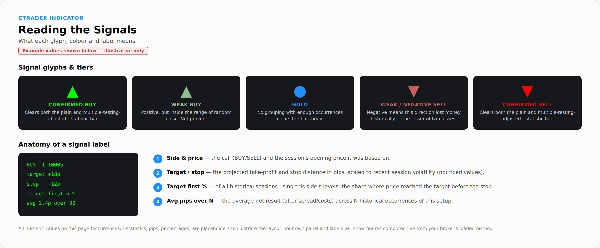
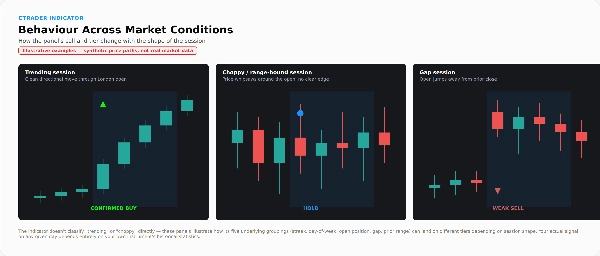
Yeşil yukarı ok, o günün Londra açılışında Alış çağrısını işaret eder; kırmızı aşağı ok Satış; mavi nokta Tut (savunulabilir bir avantaj bulunamadı) anlamına gelir. Bu tarihsel oklar yürüyerek hesaplanır — her biri sadece o günden önce mevcut olan verileri kullanır, asla günün sonucunu değil.
Grafikteki panel (sol üst) bugünün çağrısını ve bir seviye etiketini gösterir: ONAYLANDI, ONAYLANDI (düzeltilmemiş), ZAYIF veya NEGATİF. Bu, oka ne kadar güvenileceğini belirtir — ZAYIF, görünen avantajın rastgele gürültü aralığında olduğunu, NEGATİF ise o yönün tarihsel olarak para kaybettirdiğini ve okların sadece iki kayıptan daha az olan olduğunu gösterir. Panel ayrıca çağrının hangi gruplamaya dayandığını, kaç kez gerçekleştiğini, ortalama sonucu, hem basit hem de çoklu test ayarlı eşiklere karşı t-istatistiğini ve — en önemlisi — yürüyen yürüyerek skor tablosunu gösterir: aracın gerçekten kaç işlem yapacağı, kazanma oranı, toplam pip, işlem başına pip ve en kötü düşüş. Eğer bu yürüyen toplam sabit veya negatifse, panel bunu doğrudan belirtir.
Üç isteğe bağlı katman detay ekler: tam sonuç tablosu (test edilen her gruplama, örnek büyüklüğü ve her iki yön için t-istatistiği ile), sadece stop ve hedef yerleştirme konumundan kazanma oranının nasıl değiştiğini gösteren bir "stop/hedef laboratuvarı" — yüksek kazanma oranının gerçek bir avantajla aynı olmadığını göstermek için — ve tipik Londra seansının yukarı hareket, aşağı hareket ve toplam aralığını medyan/%75/%90 yüzdelik diliminde gösteren seans seviyeleri kutusu. Bugünün seansındaki noktalı çizgiler açılışı ve volatilite ölçekli beklenen yüksek/düşük seviyeyi işaret eder.
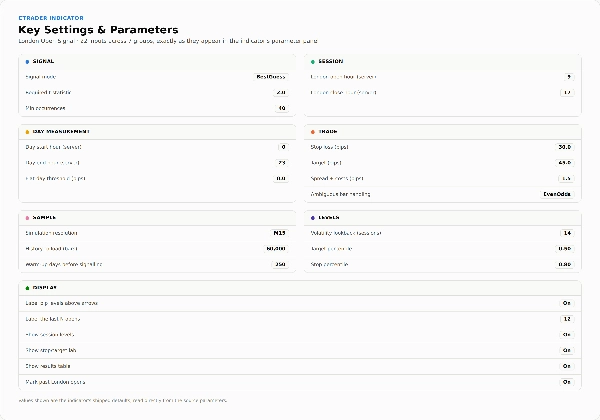
Ana ayarlar ve parametreler
- Sinyal: Mod (Sadece Onaylı vs En İyi Tahmin), Gerekli t-istatistiği, Bir gruplamanın sayılması için minimum gerçekleşme sayısı
- Seans: Londra açılış saati, Londra kapanış saati (broker sunucu saati)
- Gün ölçümü: Gün başlangıç/bitiş saati, düz gün eşiği (pip)
- İşlem: Zarar durdurma (pip), Hedef (pip), Spread/maliyet payı (pip), Belirsiz bar işleme (Kötümser / Eşit olasılık / İyimser, hem stop hem hedefe dokunan barlar için)
- Örnek: Simülasyon çözünürlüğü (H1/M15), Yüklenecek geçmiş (barlar), Aracın sinyal vermeye başlamadan önceki ısınma günleri
- Seviyeler: Volatilite geriye bakış (seanslar), Hedef yüzdelik dilimi, Stop yüzdelik dilimi
- Görüntüleme: Ok etiketleri / etiket sayısı, seans seviyelerini göster, stop-hedef laboratuvarını göster, sonuç tablosunu göster, geçmiş Londra açılışlarını işaretle
Tipik kullanım durumları ve işlem senaryoları
Londra açılışından önce paneli kontrol ederek mevcut çağrıyı, seviyesini ve gün için beklenen seans aralığını görmek. Belirli bir parite için basit, yorumlanabilir bir desenin kendi geçmişinde istatistiksel olarak geçerli olup olmadığını araştırmak — ve o desenin aynı anda birkaç fikir test edilmesinin düzeltilmesine dayanıp dayanmadığını dürüstçe görmek. Seans seviyesi projeksiyonlarını (beklenen yüksek/düşük) hedefleri veya zarar durdurmaları planlamak için alış/satış çağrısından bağımsız kullanmak. Bu araç, gözetimsiz otomatik yürütme için tasarlanmamıştır — bir gösterge, cBot değil ve asla kendi başına işlem yapmaz.
Kimler için en uygundur
Bir sinyalin arkasındaki gerçek, yürüyerek doğrulanmış performans geçmişini görmek isteyen ve bir oku okurken yanında t-istatistiği ve düşüş rakamını rahatça okuyabilen traderlar. Alış/satış çağrısını görmezden gelseler bile seans aralığı bağlamını değer veren, takdirli Londra seansı traderları. Bu araç, "sadece oku takip et" sistemini arayan biri için kasıtlı olarak tasarlanmamıştır — araç kendi sinyallerini derecelendirir ve sayılar onları işlemeyi desteklemediğinde bunu açıkça belirtir.
Önemli sınırlamalar ve kullanım notları
- Performans, gösterge çalıştığında gerçekten yüklü olan broker geçmişinden canlı olarak hesaplanır — sabit, önceden oluşturulmuş bir geriye dönük test dosyası değildir, bu nedenle sonuçlar broker/hesaba göre değişebilir ve yeterli geçmiş yüklenmesi gerekir (panel yeterli veri olmadığını bildirirse "Yüklenecek geçmiş"i artırın).
- Çoklu test ayarı bir kestirimdir, garanti değildir — ayarlanmış eşik, bir sonucun sadece şans eseri anlamlı görünme olasılığını azaltır ama ortadan kaldırmaz.
- Test edilen beş fikir basit, tek faktörlü sınıflandırıcılardır, bağımsız olarak kontrol edilir, birleştirilmez — aracı yorumlanabilir tutmak ve aşırı uyum riskini daha da artırmamak için kasıtlı bir tercihtir.
- En İyi Tahmin modunda gösterge her zaman bir yön gösterir, NEGATİF seviye çağrıları dahil — her zaman sadece oku değil, seviye etiketini de okuyun.
- Simüle edilen stop/hedef dolumları, aynı mum içinde her iki seviyeye de dokunan barlar için basitleştirilmiş bir varsayım kullanır; gerçek yürütme farklı olabilir.
- Tamamen fiyat/istatistik tabanlıdır — haber, temel veya çapraz varlık girdisi yoktur.
- Görsel ve analitiktir; işlem yapmaz.
Özet
The indicator tests five simple, independent factors—overnight streak, day of the week, opening price position within the previous day’s range, gap size, and previous day’s range width—to identify statistically significant edges. Signals are displayed as arrows on the chart: green for Buy, red for Sell, and blue for Hold, with a tier label (CONFIRMED, WEAK, NEGATIVE) indicating the confidence level based on walk-forward testing.
A panel shows detailed statistics including win rate, total pips, t-statistics, and drawdown, updated live from broker data. Optional overlays provide a full results table, stop/target sensitivity analysis, and session-level range projections. The tool is purely analytical and visual; it does not execute trades and is intended for traders comfortable interpreting statistical metrics alongside signals.








!["[Stellar Strategies] Smart ADX" logosu](https://cdn.ctrader.com/image/webp/af13b084-b6f6-41db-b7bc-c7e688b57b05_36929)