Descripción
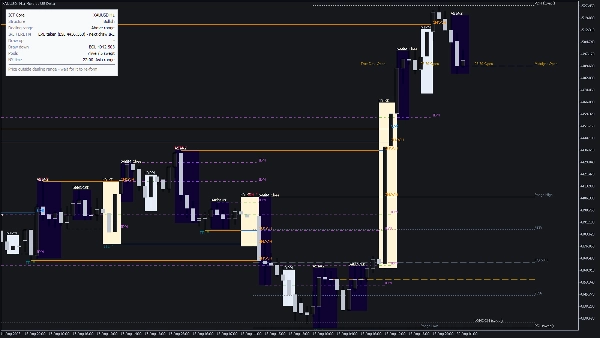
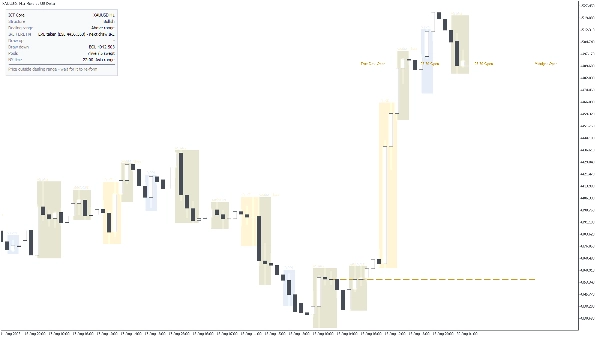
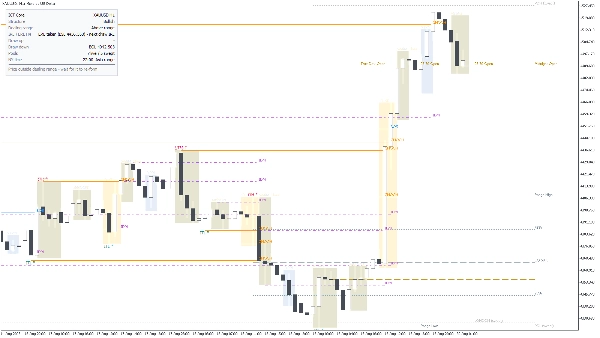
ICT Core convierte un gráfico de precios en bruto en una lectura estructurada de Smart Money Concepts (ICT): estructura del mercado, piscinas de liquidez, rango de negociación, estado IRL / ERL, sesiones de Nueva York y zonas de eliminación, además de un panel que indica el sesgo actual y el plan condicional en inglés sencillo. Solo se basa en la acción del precio cerrada y confirmada: una vez que un nivel o etiqueta se imprime, permanece donde está.
LO QUE ANALIZA
ICT Core lee datos de barras (apertura / máximo / mínimo / cierre) del símbolo del gráfico, además de un marco temporal superior de su elección (por defecto H4) para la lectura IRL / ERL. Se utiliza ATR para escalar el tamaño del swing, el espaciado de etiquetas y la tolerancia de igual-alto / igual-bajo, por lo que los mismos ajustes se comportan de manera consistente en XAUUSD, índices y FX. El tiempo de sesión y zona de eliminación se calcula en hora de Nueva York con manejo automático del horario de verano, no en horas fijas del bróker.
LO QUE DIBUJA Y CÓMO LEERLO
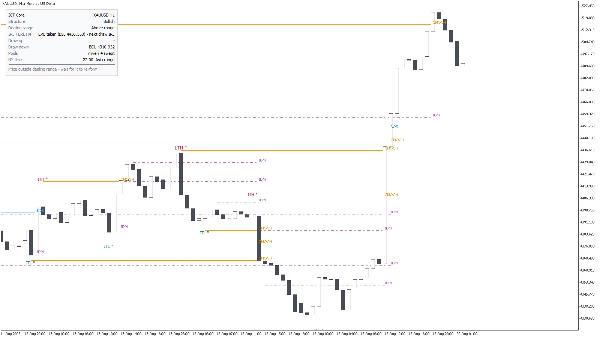
- Estructura del mercado. Los swings se clasifican como a corto plazo, a medio plazo y a largo plazo. Las rupturas se etiquetan como BOS (continuación) o CHOCH (cambio de carácter); una ruptura hecha solo por mecha se marca por separado como un barrido, para que pueda distinguir un desplazamiento real de una incursión. Los máximos y mínimos tomados por una pierna impulsiva se etiquetan como fuertes / débiles.
- Inducción (IDM). Se marca el máximo o mínimo menor que el precio probablemente recorrerá antes del movimiento real, para que pueda ver la trampa antes de que se active.
- Piscinas de liquidez. Máximos y mínimos del día anterior, semana anterior, mes anterior, sesión, y máximos / mínimos iguales se dibujan como niveles del lado comprador (BSL) y del lado vendedor (SSL). Una vez que una piscina es barrida, se atenúa en lugar de eliminarse, para que la historia de lo que ya se ha tomado siga siendo legible.
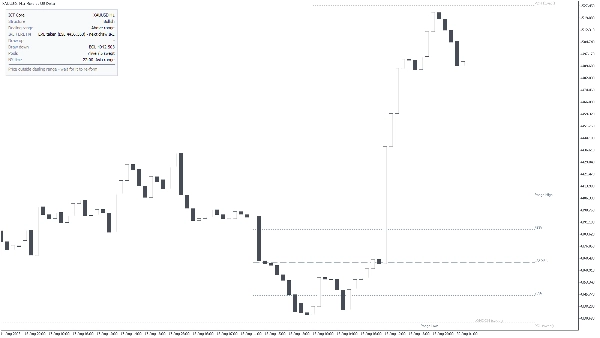
- Rango de negociación. El rango activo entre el último máximo y mínimo válidos, con cuadrantes opcionales del 25% / 75% para referencia de prima / descuento.
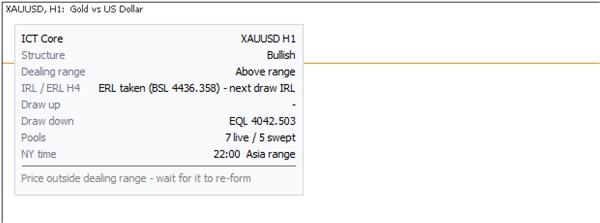
- IRL / ERL. El panel indica si se ha tomado liquidez externa y el siguiente dibujo es interno, o viceversa, leído desde el marco temporal superior que seleccione.
- Sesiones y tiempo. Cajas de Asia, Londres, NY AM y NY PM; zonas de eliminación de Londres, Nueva York y cierre de Londres; ventanas de bala de plata; macros opcionales de 20 minutos; y líneas de precio de apertura de sesión.
- Panel de información. Símbolo y marco temporal, sesgo de estructura, ubicación del precio en el rango de negociación, estado IRL / ERL, el dibujo más cercano arriba y abajo con su precio, cuántas piscinas están activas versus barridas, hora de Nueva York y la sesión activa, además de una línea de plan condicional como "Precio fuera del rango de negociación - espere a que se reforme".
- Alertas. Popup, sonido o correo electrónico en un barrido de piscina, en BOS / CHOCH, y en apertura de zona de eliminación.
AJUSTES CLAVE
- General: tema del gráfico (auto / claro / oscuro), barras a analizar (por defecto 1500), tamaño de fuente de etiquetas y separación entre etiquetas (en ATR).
- Estructura del mercado: fuerza del swing en barras a cada lado (por defecto 2), qué niveles de swing mostrar, BOS / CHOCH activado o desactivado, rupturas solo por mecha activadas o desactivadas, inducción activada o desactivada, y tamaño del impulso en ATR que califica un máximo o mínimo como fuerte (por defecto 1.0).
- Piscinas de liquidez: qué piscinas dibujar, tolerancia de igual alto / bajo en ATR (por defecto 0.15), cuántos días antes de que una piscina expire (por defecto 20), y si las piscinas barridas permanecen visibles.
- Rango de negociación: rango activado o desactivado, cuadrantes 25% / 75% activados o desactivados.
- IRL / ERL: marco temporal fuente (por defecto H4) y cuántas de sus barras escanear (por defecto 300).
- Sesiones: cajas de sesión, zonas de eliminación, bala de plata, macros, precios de apertura, cuántos días hacia atrás dibujar (por defecto 5), y opacidad del relleno de la caja.
- Panel: esquina, desplazamiento X / Y, tamaño de fuente, si mostrar la fila del plan, cuántas barras un barrido aún cuenta como reciente (por defecto 12), y si el plan requiere una zona de eliminación activa.
- Alertas y un conjunto completo de colores para cada elemento en el gráfico.
USO TÍPICO
1. Añada ICT Core a un gráfico M5 - H1 de XAUUSD, un índice o un par FX principal.
2. Lea el panel de arriba hacia abajo: sesgo, ubicación en el rango de negociación, IRL / ERL, y el dibujo más cercano arriba y abajo.
3. Espere a que una piscina de liquidez sea barrida dentro de una zona de eliminación, luego busque CHOCH contra el barrido en su marco temporal de entrada.
4. Use el dibujo opuesto mostrado en el panel como objetivo, y el extremo barrido como invalidación.
5. Active las alertas de barrido y BOS / CHOCH si no quiere estar mirando el gráfico toda la sesión.
PARA QUIÉN ES
Para traders que ya trabajan con ICT / Smart Money Concepts y quieren las capas de estructura, liquidez y tiempo en un solo gráfico en lugar de dibujarlas a mano todos los días. Está dirigido a traders discrecionales intradía y de swing corto. No es una herramienta para principiantes con flechas de compra / venta: necesita saber qué significan BOS, CHOCH, IDM, IRL y ERL para usarla.
LIMITACIONES IMPORTANTES Y NOTAS DE USO
- ICT Core es una herramienta de análisis y visualización. No realiza órdenes, no da señales de compra / venta, y la fila del plan es un recordatorio condicional, no una recomendación.
- Todo se deriva de swings confirmados, por lo que un punto de estructura aparece solo después de que se ha cerrado el número requerido de barras a cada lado (por defecto 2). Nada se redibuja después.
- Los tiempos de sesión y zona de eliminación siguen la hora de Nueva York incluyendo el horario de verano. Su gráfico se muestra en la hora del servidor del bróker, por lo que las cajas no se alinearán con un desplazamiento UTC fijo; esto es intencional.
- La lectura IRL / ERL de marco temporal superior necesita suficiente historial en ese marco; en símbolos con historial corto se muestra como no disponible.
- El análisis está limitado a la ventana de barras a analizar (por defecto 1500). Aumente para más historial, a costa de un dibujo inicial más pesado.
- Funciona en cTrader Desktop para Windows y Mac. Los indicadores personalizados no están disponibles en móvil o web.
- El trading implica riesgo. El comportamiento pasado de cualquier patrón no garantiza resultados futuros. Siempre use su propia gestión de riesgos.
Resumen
ICT Core highlights liquidity pools from previous days, weeks, months, and sessions, showing buy-side and sell-side levels, and dims swept pools to maintain historical context. It also delineates session times and killzones based on New York time with automatic daylight saving adjustments. An info panel provides a summary of current bias, price position within the dealing range, IRL/ERL status, nearest levels, live versus swept pools, and a conditional trading plan in plain English.
Users can customize settings including chart theme, swing parameters, liquidity pool visibility, session displays, and alert notifications for pool sweeps, BOS/CHOCH events, and killzone openings. ICT Core is intended for traders familiar with ICT/SMC concepts seeking an integrated, structured view of market dynamics for intraday and short-swing discretionary trading.