

present
Registrati e ricevi uno sconto da $50 sul tuo primo acquisto
Trading product for Flintridge Trader Pro Indicatore Key Levels RSI, image 1
Flintridge Trader Pro
Indicatore
Versione 1.0, Sep 2026
Windows, Mac
Trading product for Flintridge Trader Pro Indicatore Key Levels RSI, image 2
Trading product for Flintridge Trader Pro Indicatore Key Levels RSI, image 3
Trading product for Flintridge Trader Pro Indicatore Key Levels RSI, image 4
Trading product for Flintridge Trader Pro Indicatore Key Levels RSI, image 5
Trading product for Flintridge Trader Pro Indicatore Key Levels RSI, image 6
Trading product for Flintridge Trader Pro Indicatore Key Levels RSI, image 7
Trading product for Flintridge Trader Pro Indicatore Key Levels RSI, image 8
Trading product for Flintridge Trader Pro Indicatore Key Levels RSI, image 9
Trading product for Flintridge Trader Pro Indicatore Key Levels RSI, image 10
Trading product for Flintridge Trader Pro Indicatore Key Levels RSI, image 11

Descrizione

Flintridge Trader Pro marks where price has already shown its hand, and then tells you when the market turns at those places.

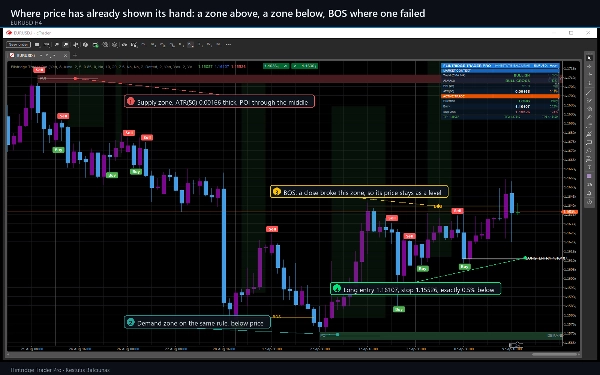
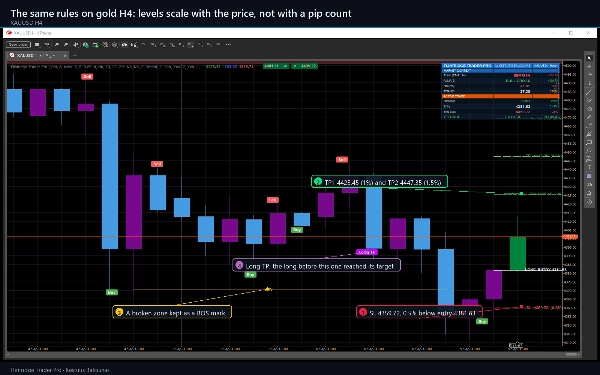
Confirmed swing pivots build supply and demand zones, each one an ATR-thick band with its point of interest through the middle. When price closes through a zone it is converted into a break of structure and marked BOS, so the level that failed stays on the chart as information instead of disappearing. Separately, a moving average of the closes and a moving average of the opens are computed on a HIGHER timeframe - eight times your chart by default - and their crossover is the signal.

What it draws on your chart

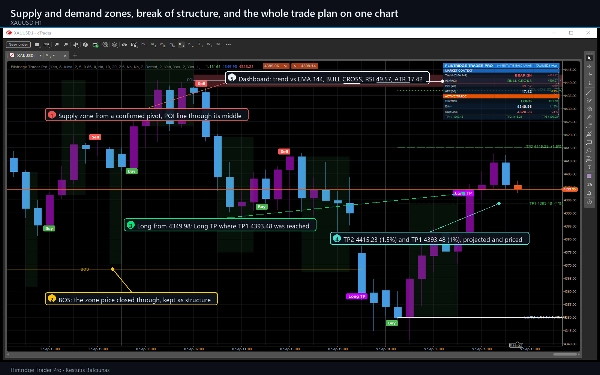
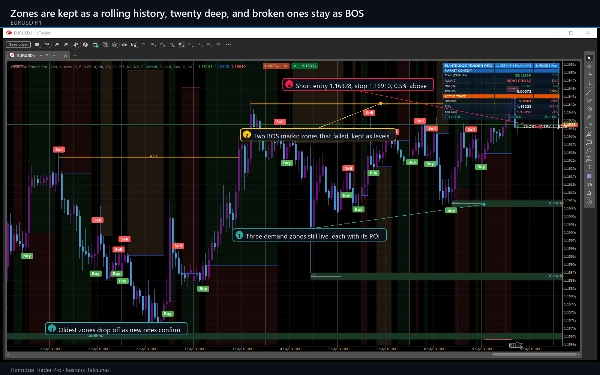
  • Supply and demand zones from confirmed swing pivots, each with a POI line, kept as a rolling history and converted to a BOS mark when broken.
  • Buy and Sell markers, and Long TP and SL markers where a level is reached.
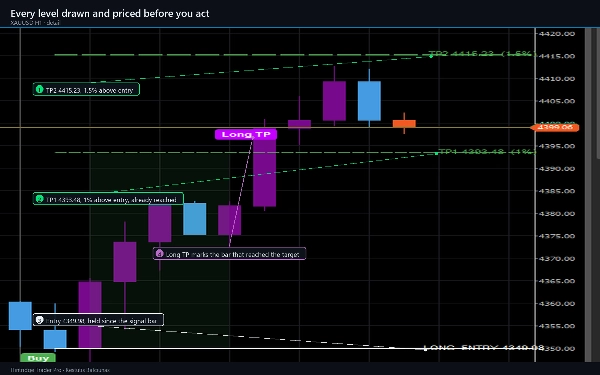
  • The entry, the stop and the first target as stepped lines, with a shaded risk band and a shaded reward band between them.
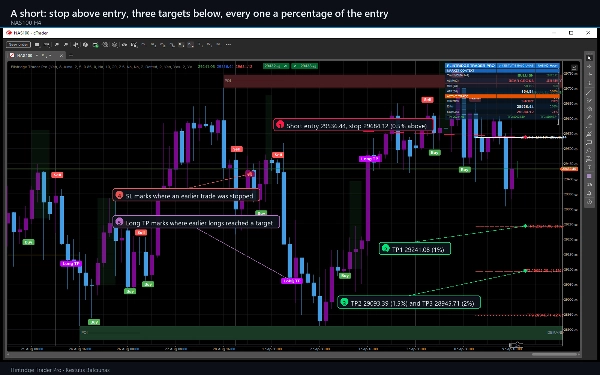
  • The last signal projected forward, with the entry, the stop and all three targets drawn and labelled with their price and their percentage.
  • Optional HH, LH, HL and LL swing labels, and an optional support and resistance layer with up to 21 levels and their zones.
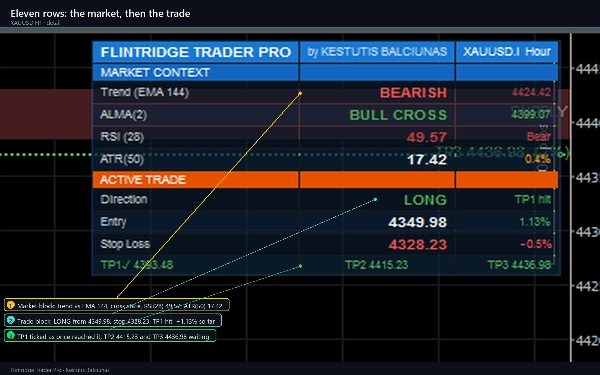
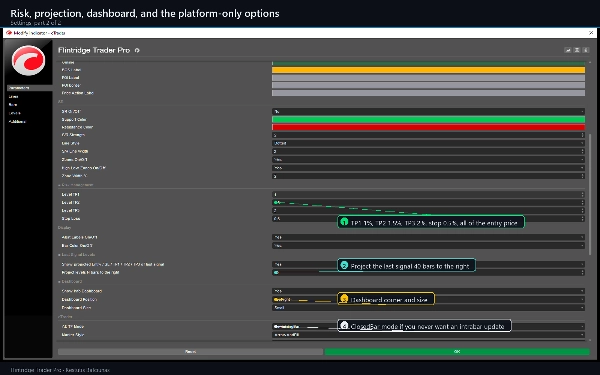
  • An eleven row dashboard: trend against the 144 EMA, the crossover state, RSI, ATR, then the live trade with its direction, stage, entry, stop and three targets, each ticked as price reaches it.
  • Candles recoloured so the direction of each bar is readable at a glance.

How to trade with it

  1. Give it history. On the default settings it needs about 250 bars before anything appears, and it needs enough data on the higher timeframe for the first crossover to exist.
  2. Read the zones first. A Buy inside a demand zone and a Sell inside a supply zone are the setups the tool is built to show you.
  3. Take the levels as drawn. The stop and the three targets are percentages of the entry price, 0.5, 1, 1.5 and 2 by default, and every one of them is on the chart before you act.
  4. Use the dashboard for context, not permission. Trend, crossover, RSI and ATR describe the market; none of them blocks a signal unless you switch on the optional filters.

Settings that matter most

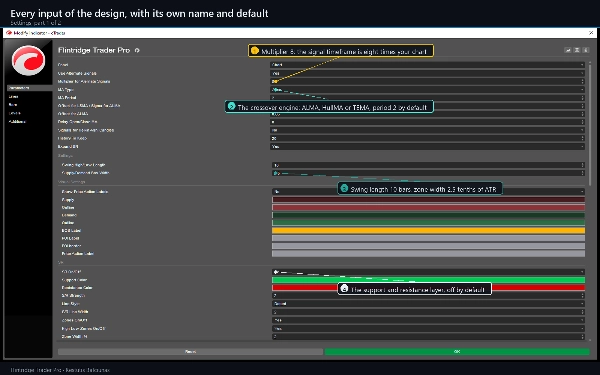
  • MA Type and MA Period choose the crossover engine: ALMA, HullMA or TEMA.
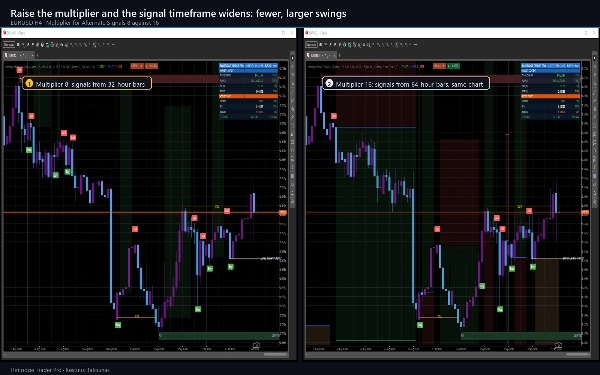
  • Multiplier for Alternate Signals sets how much higher the signal timeframe is than your chart.
  • Swing High/Low Length and Supply/Demand Box Width control how many zones you get and how thick they are.
  • Level TP1, TP2, TP3 and Stop Loss are percentages of entry, and shorts reuse the same four numbers.
  • Three optional filters - an EMA 144 trend gate, an RSI gate and a minimum bar gap between entries - are provided for traders who want fewer signals. They are OFF by default.

Where it works

Any symbol and any timeframe. It was designed around M15, H1 and H4, and it is at home on forex majors, gold and the major indices; it works on crypto too, where the zones tend to be wider because ATR is. Lower timeframes give many more signals, which is what the optional filters and the higher timeframe multiplier are there to control.

Alerts

Twelve events, each with its own switch: long and short entries, the three targets for each direction, and the stops. They go to the cTrader log, an optional sound, and cTrader's own e-mail. Alerts fire on closed bars only, never for history that closed before you attached the indicator, and never twice for the same bar.

Requirements and behaviour

cTrader 5.0 or newer, desktop. The indicator declares no access rights: it opens no network connection, reads no file, and never places, modifies or closes an order. A signal is evaluated on a closed bar and does not move afterwards. Two things are provisional while the newest bar forms - the newest zone, whose pivot is not yet confirmed, and the higher timeframe value, which is read from the bar that contains the current one. A setting is provided to read the previous completed higher timeframe bar instead, which never repaints.

This is analytical software and nothing it draws is advice. The target and stop marks record only that price touched a level drawn on the loaded history; there is no spread, commission or slippage behind them and no order was placed.

Trading involves risk. Past performance does not guarantee future results.

Riepilogo

Profilo indicatore
Categoria indicatore
Struttura del mercato (SMC)
Tipo di output
Segnali
Requisiti per i dati
Solo barre
Segnali supportati
Superamento
Forza del trend
Livello rotto
Inversione

Recensioni dei clienti

0.0
Recensioni: 0
Recensioni dei clienti
Questo prodotto non ha ancora ricevuto recensioni. L'hai già provato? Fallo sapere agli altri per primo!

Discussioni

Domande frequenti

Key Levels
RSI
Market Structure
Supply & Demand
ATR
Moving Average
Support & Resistance
I prodotti disponibili tramite cTrader Store, inclusi bot di trading, indicatori e plugin, sono forniti da sviluppatori terzi e resi disponibili esclusivamente a scopo informativo e di accesso tecnico. cTrader Store non è un broker e non fornisce consulenze in materia di investimento, raccomandazioni individualizzate o garanzie di risultati futuri.

Altro da questo autore

Indicatore
ATR
BOS
+5
Know how strong each Supertrend flip is: scored BUY/SELL, structure stop + 3 targets, live win-rate dashboard, alerts.
Indicatore
ADX
ATR
+5
Scored breakouts of sloped pivot trendlines: four filters on the break bar, ATR stop, 1:1 / 1:2 / 1:3 targets, alerts.
Indicatore
ATR
Volume
+3
Fibonacci trend signals on closed bars, with an ATR stop, up to four targets and a break-even ladder.
Indicatore
ADX
ATR
+5
Ten confluence layers scored on every closed bar, with an anti-chop gate, pivot levels and a live dashboard.
Indicatore
Volume
Channel
+3
A higher-timeframe log-regression channel with a volume profile, Point of Control and session levels.
Indicatore
Volume
Key Levels
+1
Fixed-grid volume profile: bull and bear volume at every price level, with Point of Control and value area.
Indicatore
ADX
ATR
+5
SuperTrend signals scored on five confluence factors, with an ATR stop, three targets and a dashboard.

Potrebbe interessarti anche

Indicatore
RSI
Prop
+14
Unlock Stochastic RSI PRO in cTrader! Overlay RSI, highlight zones, and identify divergences with customizable settings.
Indicatore
Spread Filter
SpreadSync Entry Timer is a compact cTrader indicator that shows live spread and candle-close.
Indicatore
ATR
RSI
+6
🔍 MultiScalpScorePRO – Powerful real-time scoring system combining indicators for ultra-precise scalping signals.
Indicatore
AI
Grid
+17
Clean 3D, Sleek Candles for Trend Patterns.
Indicatore
This indicator can be used to: change color, shape size, position, change font, increase or decrease, and other function
Logo di "supertrend"
Popolare
4.3
(3)
$20
Indicatore
ATR
Prop
+4
Supertrend Indicator
Indicatore
ATR
VWAP
+17
Hybrid adaptive trend filter with clean Buy/Sell signals, dynamic bands and zero-repaint analysis.
Indicatore
ATR
Volume
+3
Fibonacci trend signals on closed bars, with an ATR stop, up to four targets and a break-even ladder.
Indicatore
Volume
Imbalance
+5
Spot Institutional Order Flow with Proportional Volume Bubbles & Integrated Cumulative Volume Delta (CVD) Intelligence.
Indicatore
Indices
Commodities
The Advanced CCI & EMA Indicator combines the CCI with 40 & 80 EMA logic to generate precise arrows signaling direction
Indicatore
Overlay HTF context on any chart: color bars by HTF and draw filled HTF bodies with optional High/Low lines.
Indicatore
ADX
ATR
+5
SuperTrend signals scored on five confluence factors, with an ATR stop, three targets and a dashboard.
Indicatore
Support & Resistance
Detects Gartley, Bat, Butterfly, Crab, Shark & Cypher patterns and backtests each one's real win rate.
Indicatore
ATR
SMC
+21
MA Quant Adaptive Price Zone Oscillator identifie dynamiquement les zones de prix optimales pour les entrées et sorties.
Indicatore
AI
ATR
+26
SMC without the mess: Clean structure + auto-managing FVGs + MTF panel. Hard-right-edge, step size-based for any symbol.
Logo di "ATR Bands"
Popolare
4.7
(4)
$19
Indicatore
ATR
Prop
+13
Enhance trading with ATR Bands! Visualize market volatility using dynamic upper and lower ATR bands for precise decision
Indicatore
RSI
MACD
+2
A straightforward yet effective tool signals entry points for both buying and selling. Include 3 Moving Average
Indicatore
Volume
Key Levels
+2
Support and resistance from a rolling volume profile, ranked by strength or recency, updated live.

Prezzo





























