


Descrizione
Rigid Volume Profile suddivide la tua finestra di analisi in un numero fisso di livelli di prezzo e mostra quanto volume è stato scambiato in ciascuno, suddiviso in pressione di acquisto e vendita.
COSA DISEGNA
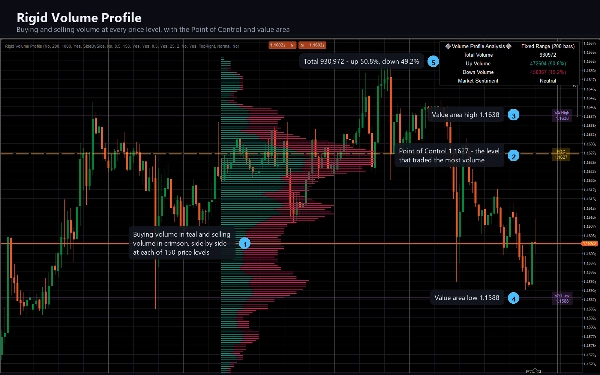
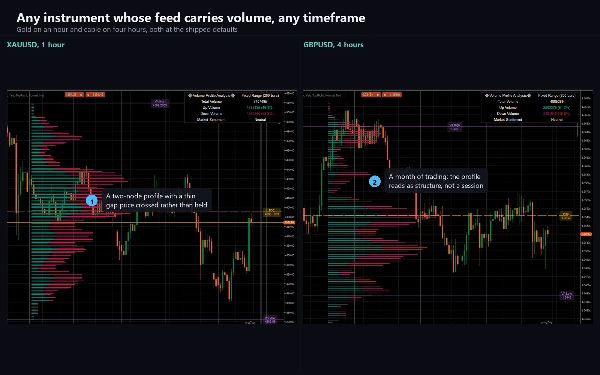
Un istogramma orizzontale accanto all'azione del prezzo, costruito dagli ultimi N barre. La barra di ogni livello è suddivisa in volume rialzista (da barre che hanno chiuso in rialzo) e volume ribassista (da barre che hanno chiuso in ribasso), così puoi vedere non solo dove è avvenuto il trading ma anche quale parte lo stava facendo. Le barre che hanno chiuso invariati dividono il loro volume equamente tra le due parti.
Una linea tratteggiata del Punto di Controllo segna il livello di prezzo che ha scambiato il maggior volume nella finestra, etichettata con il suo prezzo esatto.
Due linee dell'area di valore delimitano i livelli che rappresentano il 70% del volume della finestra, ciascuna etichettata.
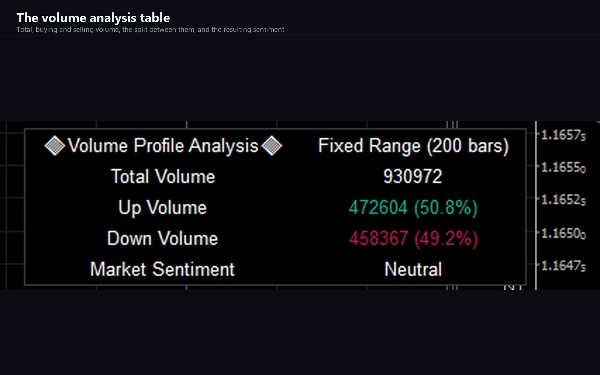
Una tabella di analisi del volume riporta il volume totale, in aumento e in diminuzione con percentuali, e una lettura del sentiment basata su quale lato domina.
COME USARLO
I profili di volume descrivono dove è avvenuto effettivamente il trading, piuttosto che dove il prezzo si è semplicemente mosso. Un livello che ha assorbito molto volume è un livello a cui molti partecipanti tengono; una parte sottile del profilo è un intervallo di prezzo attraverso cui il mercato si è mosso rapidamente.
Leggi il Punto di Controllo come il centro di gravità della finestra. Leggi l'area di valore come l'intervallo in cui è stata fatta la maggior parte degli affari. Leggi un gap sottile tra due nodi pesanti come una zona che il prezzo tende a attraversare piuttosto che a sostare. Osserva quale lato della divisione domina un livello quando il prezzo vi ritorna.
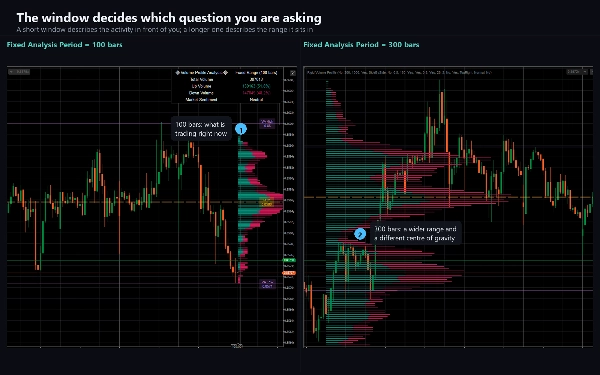
La finestra è a tua scelta e l'immagine cambia con essa, quindi scegli un lookback che corrisponda alla decisione che stai prendendo. Un profilo di 100 barre risponde a una domanda diversa da uno di 500 barre.
IMPOSTAZIONI CHIAVE
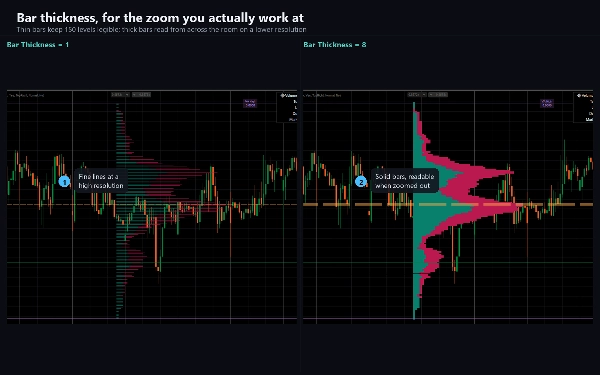
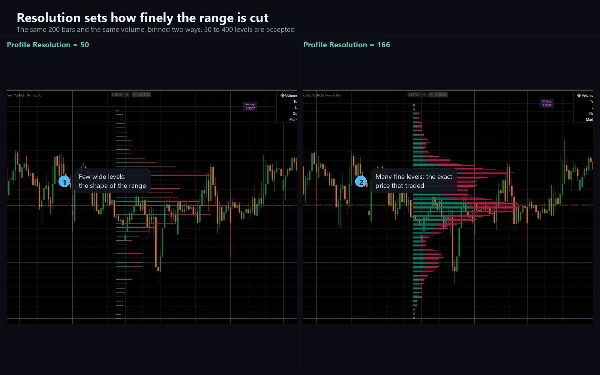
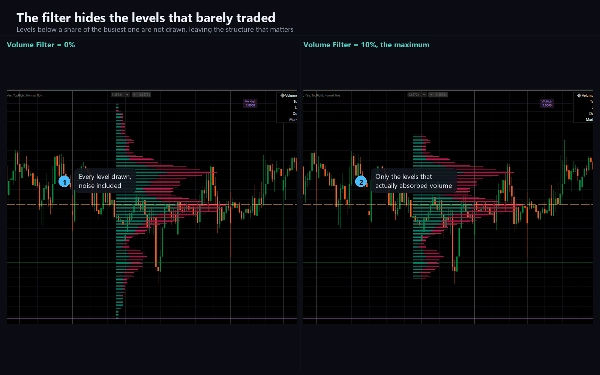
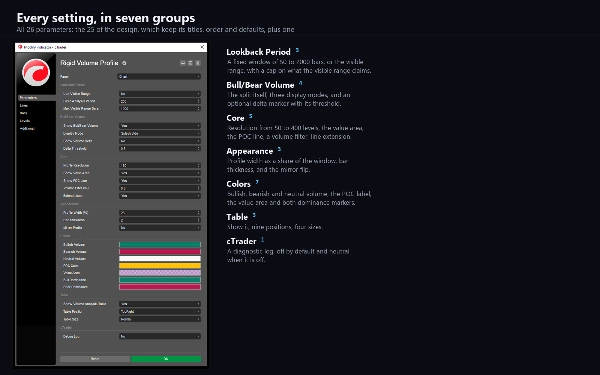
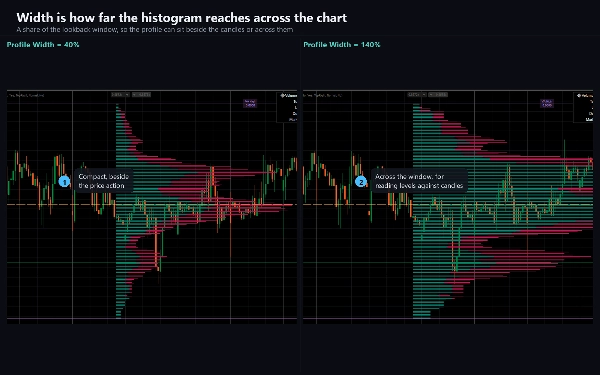
Periodo di Analisi Fisso imposta il lookback in barre, da 50 a 2000. Risoluzione del Profilo imposta in quanti livelli di prezzo è diviso l'intervallo, da 50 a 400; meno livelli leggono come un profilo classico, più livelli danno dettagli fini. Modalità di Visualizzazione offre Affiancato, Impilato e Diviso. Larghezza del Profilo scala l'istogramma come percentuale del lookback. Filtro Volume nasconde i livelli sotto una percentuale di quello più trafficato. Mostra Delta Volume aggiunge un marcatore dove un lato domina chiaramente. Ogni colore è regolabile, e la tabella di analisi può essere spostata in una qualsiasi delle nove posizioni o disattivata.
Usa Intervallo Visibile cambia il lookback alle barre attualmente sullo schermo invece di un conteggio fisso.
TIPO DI INDICATORE E FINESTRA
Sovrapposizione sul grafico. Disegna sul grafico dei prezzi stesso, non in un pannello separato.
TIMEFRAME E STRUMENTI
Qualsiasi timeframe. È più utile intraday, da M5 a H4, dove la distribuzione del volume di una sessione è un oggetto significativo.
Funziona su qualsiasi strumento il cui feed trasmetta volume. Sul forex questo è volume tick, il numero di aggiornamenti di prezzo per barra, che è un proxy per l'attività piuttosto che per la dimensione scambiata. Su CFD di indici e materie prime alcuni broker forniscono volume reale di borsa, e il profilo è più significativo lì. Su uno strumento senza volume, non viene disegnato nulla.
A CHI È RIVOLTO
Trader che già lavorano con profili di volume e vogliono uno con una griglia fissa regolabile e una suddivisione esplicita di acquisto e vendita, piuttosto che un profilo di sessione fisso.
VERSIONE DI PROVA
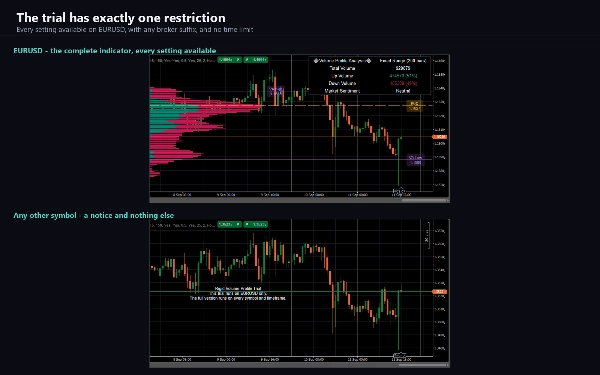
Una versione di prova è allegata a questo prodotto. È l'indicatore completo con tutte le impostazioni disponibili, limitato a EURUSD. La versione completa rimuove questa limitazione e non aggiunge altro.
NOTE TECNICHE E LIMITAZIONI
Il profilo viene ricalcolato ad ogni tick della barra in formazione, quindi il Punto di Controllo e l'area di valore si muovono all'interno di una barra e si stabilizzano quando questa chiude. Questo è voluto. Nulla qui è un segnale di barra chiusa.
Con Risoluzione del Profilo superiore a 166 i livelli di prezzo più bassi non vengono disegnati. Questo è un limite deliberato del design, che riserva un pool fisso di oggetti di disegno e ne usa tre per livello di prezzo; i toggle Mostra Linea POC e Mostra Area di Valore liberano ciascuno uno. Mantieni la Risoluzione del Profilo a 166 o meno per vedere il profilo completo.
L'area di valore è costruita ordinando i livelli per volume e prendendoli in quell'ordine fino a raggiungere il 70%, quindi riportando il prezzo più alto e più basso tra essi. È quindi solitamente più ampia di un'area di valore costruita camminando verso l'esterno dal Punto di Controllo.
Poiché il profilo è costruito dal volume del tuo broker, due broker non produrranno un profilo identico dallo stesso mercato.
AccessRights è Nessuno: l'indicatore non piazza ordini, non modifica nulla e non legge dati del conto.
SUPPORTO
La documentazione copre ogni parametro, le impostazioni che sorprendono le persone e una guida alla risoluzione dei problemi è fornita con il prodotto. Le domande sono benvenute tramite la scheda Discussione; un report utile indica simbolo, broker, timeframe, versione di cTrader e le impostazioni modificate rispetto al default.
Il trading comporta rischi. Le performance passate non garantiscono risultati futuri.
Riepilogo
Users can customize the lookback period (50 to 2000 bars), profile resolution (50 to 400 levels), display mode (side by side, stacked, split), profile width, and volume filtering. The profile updates dynamically on every tick of the forming bar. It supports any timeframe and instruments with volume data, including tick volume for forex and real exchange volume for some CFDs. The indicator is intended for traders familiar with volume profiles seeking detailed buying and selling pressure insights on a fixed grid rather than session-based profiles. A trial version is available with full features restricted to EURUSD.





























