Descrizione
Indicatore del Pattern Hammer – Spiegazione della Strategia
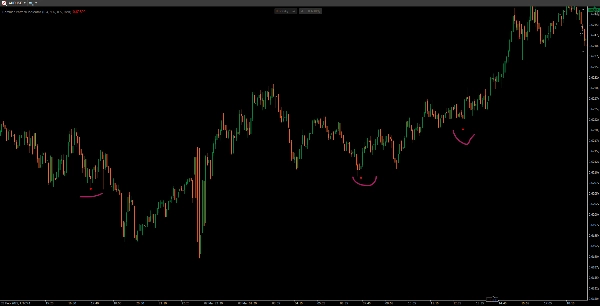
Questo Indicatore del Pattern Hammer è un segnale di inversione basato sui candlestick che identifica pattern hammer rialzisti in un trend ribassista. È progettato per rilevare potenziali inversioni di tendenza e evidenziare opportunità di acquisto.
Come Funziona
1️⃣ Rileva il Trend Ribassista
- Il prezzo di chiusura della candela deve essere inferiore alla chiusura di 3 barre fa, indicando un potenziale trend ribassista.
2️⃣ Valida la Struttura del Candlestick Hammer
- Corpo Piccolo: Il corpo della candela è relativamente piccolo (≤ 30% dell'intervallo totale).
- Ombra Inferiore Lunga: Lo stoppino inferiore è almeno 2 volte la dimensione del corpo (mostra una forte reiezione dei prezzi più bassi).
- Ombra Superiore Corta: Lo stoppino superiore è ≤ 30% della dimensione del corpo (indicando poca resistenza nella parte superiore).
3️⃣ Traccia un Segnale di Acquisto
- Se tutte le condizioni sono soddisfatte, appare un punto rosso (o un colore scelto) leggermente sotto il minimo della candela hammer come conferma visiva di una potenziale inversione.
Caratteristiche Chiave
✅ Filtra segnali deboli assicurando un trend ribassista precedente.
✅ Parametri personalizzabili per dimensione del corpo, lunghezza delle ombre e colori.
✅ Pattern di candlestick semplice ma efficace per trader swing e trader di price action.
📌 Uso Migliore: Confermare il pattern hammer con indicatori aggiuntivi (es. volume, livelli di supporto) per segnali più forti! 🚀
Riepilogo
Recensioni dei clienti
5 | 100 % | |
4 | 0 % | |
3 | 0 % | |
2 | 0 % | |
1 | 0 % |