Descrição
Média Móvel Ponderada Quântica (QWMA)
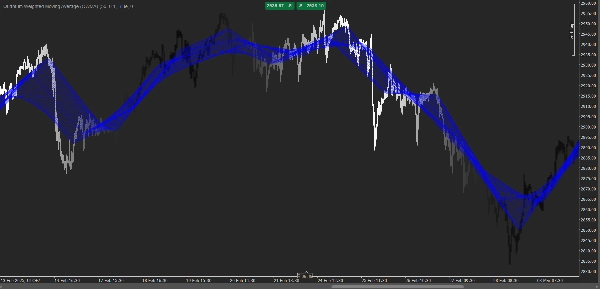
A Média Móvel Ponderada Quântica (QWMA) é um indicador avançado de negociação projetado para ajustar dinamicamente a ponderação dos preços passados com base nas condições do mercado. Ao contrário das médias móveis tradicionais que aplicam pesos fixos, a QWMA usa uma função de decaimento exponencial adaptativa para atribuir maior importância aos movimentos recentes dos preços, considerando também os dados históricos.
Principais Características:
✅ Ponderação Adaptativa: Ajusta a influência dos preços passados com base na volatilidade e na força da tendência.
✅ Sensibilidade Aprimorada: Reage mais rapidamente às mudanças de preço em comparação com médias móveis simples e exponenciais.
✅ Redução de Ruído: Ajuda a filtrar o ruído do mercado enquanto preserva a clareza da tendência.
✅ Parâmetros Personalizáveis: Permite que os traders modifiquem fatores de decaimento e funções de ponderação para adequar-se a diferentes estratégias de negociação.
Como Funciona:
A QWMA aplica uma função de decaimento exponencial aos dados de preços passados, garantindo que preços mais antigos tenham influência decrescente enquanto valores recentes contribuem de forma mais significativa. Isso resulta em uma linha de tendência mais suave, porém mais responsiva, que se adapta às dinâmicas de mercado em mudança.
Ideal Para:
📈 Seguidores de Tendência – Identificar tendências fortes com atraso mínimo.
📉 Traders de Swing – Detectar reversões de mercado mais cedo do que médias móveis padrão.
💹 Scalpers – Obter insights rápidos sobre mudanças de momentum de curto prazo.
A QWMA é uma ferramenta poderosa para traders que buscam um equilíbrio entre suavidade e responsividade, tornando-a adequada para vários mercados financeiros, incluindo ações, forex e negociação de criptomoedas. 🚀
Resumo
Avaliações de clientes
5 | 0 % | |
4 | 100 % | |
3 | 0 % | |
2 | 0 % | |
1 | 0 % |