
ACTO-v1
Indicador
Versão 1.0, Mar 2025
Windows, Mac
4.5
Avaliações: 2
Descrição
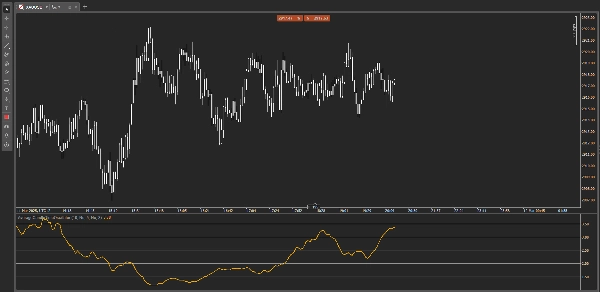
Oscilador de Tempo Médio de Vela (ACTO)
Melhore seu desempenho de negociação com o ACTO, o oscilador avançado que analisa a duração média das velas do gráfico, permitindo que você identifique rapidamente mudanças na volatilidade e na atividade do mercado.
Por que escolher o ACTO?
- Medição Precisa do Tempo da Vela: Detecte facilmente condições de mercado lentas ou rápidas para otimizar suas entradas e saídas.
- Limite Personalizável: Defina limites específicos para destacar momentos críticos e reagir prontamente às mudanças no ritmo do mercado.
- Alertas Automáticos: Receba notificações imediatas quando a duração média da vela ultrapassar seu limite definido, garantindo que você nunca perca oportunidades importantes de negociação.
- Interface Amigável: Exibição simples e intuitiva, adequada para traders de todos os níveis de habilidade.
Perfeito para scalping, day trading e negociações em prazos curtos, o ACTO é uma ferramenta essencial para qualquer trader que deseja antecipar movimentos significativos do mercado com base na dinâmica do tempo de mercado.
Outros indicadores
Resumo
Perfil do indicador
Avaliações de clientes
4.5
Avaliações: 2
5 | 50 % | |
4 | 50 % | |
3 | 0 % | |
2 | 0 % | |
1 | 0 % |
Avaliações de clientes
March 19, 2025
The product earns time when it gives the trader a reason to pause. Demo first makes more sense.
March 15, 2025
Bad impulses show up less often in the notes, but the market context still matters.
Conversa
Perguntas frequentes
Scalping
Os produtos disponíveis através da cTrader Store, incluindo bots de negociação, indicadores e plugins, são fornecidos por programadores terceiros e são disponibilizados apenas para fins informativos e de acesso técnico. A cTrader Store não é um corretor e não fornece aconselhamento em matéria de investimento, recomendações pessoais ou qualquer garantia de desempenho no futuro.
Mais deste autor


Preço
378.94M
Volume negociado
1.9M
Pips ganhos