
Descrizione
📈 Indicatore Divergency v1.1 per cTrader: Una Guida Completa 🚀
L'indicatore Divergency v1.1 è uno strumento potente progettato per la piattaforma cTrader per identificare divergenze e correlazioni tra l'azione del prezzo e vari oscillatori. Questa guida fornisce una descrizione dettagliata del codice, della sua funzionalità e istruzioni passo-passo su come utilizzarlo efficacemente. Che tu sia un principiante o un trader esperto, questo indicatore può migliorare la tua analisi tecnica con impostazioni personalizzabili e segnali visivi. Immergiamoci! 🌟
🎯 Panoramica dell'Indicatore Divergency11
L'indicatore Divergency v1.1 analizza i movimenti di prezzo e il comportamento degli oscillatori per rilevare:
- Divergenze Regolari: Segnala potenziali inversioni quando prezzo e indicatore si muovono in direzioni opposte.
- Divergenze Nascoste: Indica la continuazione del trend quando prezzo e indicatore si allineano in modo diverso.
- Correlazioni: Evidenzia quando prezzo e indicatore si muovono in sincronia, suggerendo la forza del trend.
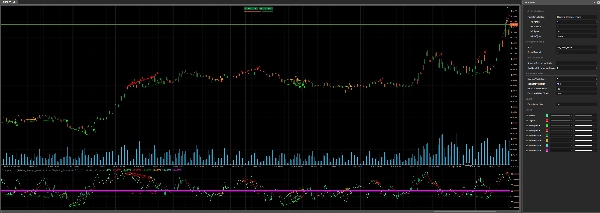
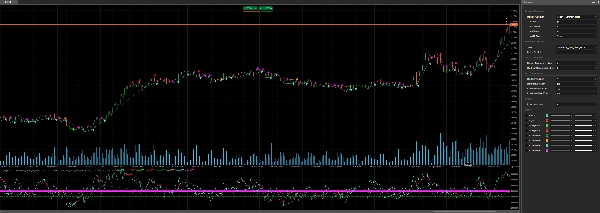
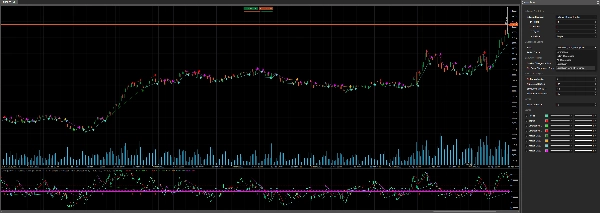
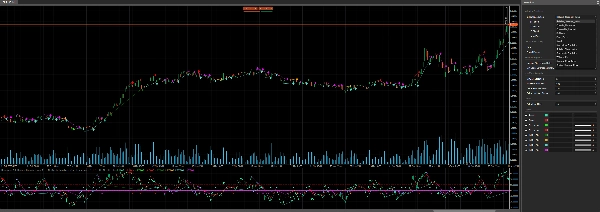
Supporta 12 diversi oscillatori (ad esempio, RSI, MACD, Stocastico) e permette la personalizzazione dei parametri di rilevamento delle divergenze, rendendolo versatile per varie strategie di trading. L'indicatore traccia i segnali direttamente sul grafico e nell'area dell'indicatore, utilizzando linee colorate, icone e testo per una visualizzazione chiara. 📊
🔍 Analisi del Codice
1. Configurazione dell'Indicatore 🛠️
- Namespace e Classe: Definiti nel namespace
cAlgocomeDivergency v1.1, ereditando daIndicator. - Attributi:
-
IsOverlay = false: Visualizzato in una finestra indicatore separata.TimeZone = TimeZones.UTC: Usa UTC per coerenza.AccessRights = AccessRights.None: Nessun permesso speciale richiesto.
2. Parametri ⚙️
L'indicatore offre un'ampia personalizzazione tramite parametri, raggruppati per chiarezza:
- Selezione Oscillatore:
-
IndicatorSelection: Scegli tra 12 oscillatori (ad esempio, RSI, MACD, Stocastico). (Normalizzato a 50 come centro, e risultato più alto per il processo di ottimizzazione)Value1,Value2,Value3: Regola periodo, smoothing e impostazioni della linea di segnale.MaType: Seleziona il tipo di media mobile (ad esempio, Semplice, Esponenziale).
- Impostazioni Divergenza:
-
Strat: Scegli la modalità di rilevamento (Divergenza, Divergenza Nascosta, Correlazione o combinazioni).PeriodFractal: Imposta il periodo del fractal per identificare picchi/avvallamenti (deve essere dispari).LookBack: Numero di divergenze storiche da analizzare.MinCountDivergenceShow: Numero minimo di divergenze richieste per mostrare i segnali.
- Analisi Zona:
-
MinBarsValidation,MaxBarsValidation: Definisce l'intervallo valido di barre per il rilevamento delle divergenze.ExtraLevelMin,ExtraLevelMax: Imposta le soglie di ipercomprato/ipervenduto per l'oscillatore.
- Livelli:
-
ExtraLevelLine: Regola le linee di ipervenduto/ipercomprato intorno al livello 50.
3. Output 📈
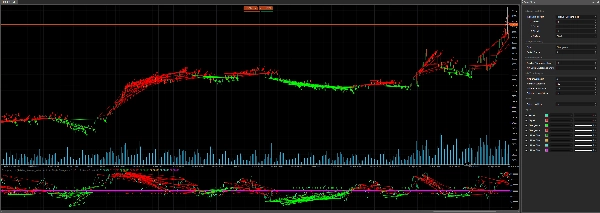
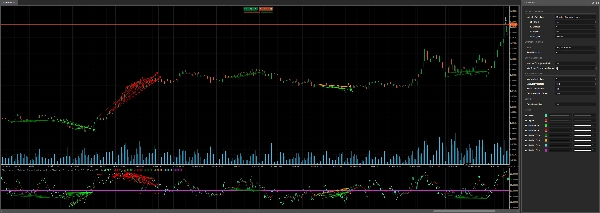
Result: Valore principale dell'oscillatore (linea verde).Signal: Linea di segnale smussata (linea rossa).- Segnali di divergenza (tracciati come punti):
-
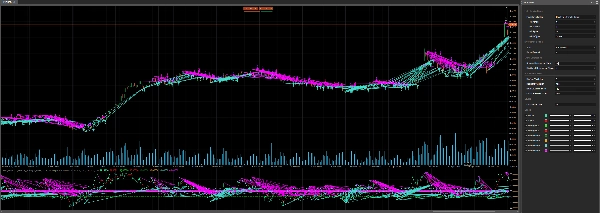
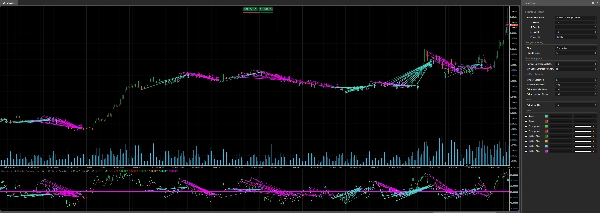
ResDivergenceUp(Lime),ResDivergenceDown(Rosso): Divergenze regolari.ResDivergenceUpHidden(Verde),ResDivergenceDownHidden(Arancione): Divergenze nascoste.ResCorrelationUp(Turchese),ResCorrelationDown(Magenta): Correlazioni.
4. Funzioni Chiave 🧠
- Initialize(): Configura l'indicatore, valida i parametri e disegna linee statiche (ipervenduto, ipercomprato, zero).
- Calculate(): Calcola i valori dell'oscillatore, li normalizza intorno a 50 e rileva i fractal per l'analisi delle divergenze.
- GetFractal(): Identifica picchi (fractalUp) e avvallamenti (fractalDown) nell'oscillatore.
- GetDivergence(): Analizza i punti fractal per rilevare divergenze o correlazioni.
- CreateLine(): Disegna linee di tendenza e icone per i segnali rilevati.
- DawDivergence(): Visualizza le divergenze con linee e frecce sul grafico e nell'area dell'indicatore.
5. Classi di Supporto 📋
SRPrice: Memorizza dati fractal (indice, prezzo, valore indicatore).DivergenceFind: Tiene traccia dei dettagli della divergenza (titolo, tempo, prezzi, colore).
6. Gestione degli Errori 🚨
L'indicatore verifica parametri non validi (ad esempio, MinBarsValidation > MaxBarsValidation, periodo PeriodFractal pari) e mostra avvisi nell'area dell'indicatore usando DrawStaticText.
🛠️ Come Usare l'Indicatore Divergency11
Passo 1: Installazione 📥
- Scarica il Codice: Copia il codice C# fornito.
- Aggiungi a cTrader:
-
- Apri cTrader e vai su cAlgo > Indicators.
- Clicca New e incolla il codice nell'editor.
- Compila l'indicatore (assicurati che non ci siano errori di compilazione).
- Applica al Grafico:
-
- Apri un grafico in cTrader.
- Aggiungi l'indicatore Divergency11 dalla lista degli indicatori.
Passo 2: Configura i Parametri ⚙️
Personalizza le impostazioni per adattarle al tuo stile di trading:
- Scegli un Oscillatore:
-
- Seleziona un oscillatore (ad esempio,
Relative_Strenght_Indexper RSI) tramiteIndicatorSelection. - Regola
Value1(periodo),Value2(smussatura) eValue3(periodo segnale) secondo necessità.
- Seleziona un oscillatore (ad esempio,
- Imposta il Tipo di Divergenza:
-
- Usa
Stratper concentrarti suDivergence,Hiden_Divergence,CorrelationoAll_Divergence.
- Usa
- Fractal e Lookback:
-
- Imposta
PeriodFractala un numero dispari (ad esempio, 5) per simmetria. - Regola
LookBackper controllare quante divergenze storiche vengono analizzate.
- Imposta
- Zona e Livelli:
-
- Configura
ExtraLevelMineExtraLevelMaxper le zone di ipercomprato/ipervenduto. - Imposta
ExtraLevelLineper regolare le soglie visive.
- Configura
Passo 3: Interpreta i Segnali 📊
- Divergenza Regolare:
-
- Su (Lime): Segnale ribassista (il prezzo fa massimi più alti, l'oscillatore fa massimi più bassi).
- Giù (Rosso): Segnale rialzista (il prezzo fa minimi più bassi, l'oscillatore fa minimi più alti).
- Divergenza Nascosta:
-
- Su (Verde): Continuazione rialzista (il prezzo fa massimi più bassi, l'oscillatore fa massimi più alti).
- Giù (Arancione): Continuazione ribassista (il prezzo fa minimi più alti, l'oscillatore fa minimi più bassi).
- Correlazione:
-
- Su (Turchese): Forte trend rialzista (prezzo e oscillatore entrambi in crescita).
- Giù (Magenta): Forte trend ribassista (prezzo e oscillatore entrambi in calo).
- Segnali Visivi:
-
- Le linee di tendenza collegano i punti di divergenza sul grafico e sull'indicatore.
- Le frecce indicano la direzione del segnale (su/giù).
- Il testo mostra il numero di divergenze rilevate (se
LookBack > 1).
Passo 4: Strategie di Trading 💡
- Trading di Inversione:
-
- Usa le divergenze regolari (Lime/Rosso) per individuare potenziali inversioni.
- Conferma con altri indicatori (ad esempio, supporto/resistenza, pattern di candele).
- Continuazione del Trend:
-
- Le divergenze nascoste (Verde/Arancione) segnalano la continuazione del trend.
- Entra nelle operazioni nella direzione del trend dopo un ritracciamento.
- Forza del Trend:
-
- Le correlazioni (Turchese/Magenta) confermano trend forti.
- Usale come filtro per evitare operazioni contro trend.
- Timeframe:
-
- Funziona su qualsiasi timeframe, ma i timeframe più alti (H1, H4) riducono il rumore.
- Gestione del Rischio:
-
- Imposta stop-loss sotto i recenti minimi oscillanti (per posizioni long) o sopra i massimi oscillanti (per posizioni short).
- Usa l'ATR (incluso nel codice) per dimensionare le posizioni.
Passo 5: Ottimizzazione 🔧
- Backtest: Usa la funzione di backtesting di cTrader per testare l'indicatore su dati storici.
- Regola i Parametri: Sperimenta con
PeriodFractal,LookBackeMinCountDivergenceShowper ridurre i falsi segnali. - Combina Indicatori: Abbina con indicatori di trend (ad esempio, Medie Mobili) o strumenti di volatilità (ad esempio, Bande di Bollinger).
🌟 Consigli per il Successo
- Inizia Semplice: Parti con le impostazioni predefinite e un oscillatore familiare come RSI.
- Esercitati su Demo: Testa l'indicatore su un conto demo per comprendere i suoi segnali.
- Monitora gli Avvisi: Osserva frecce e linee di tendenza per agire prontamente sui segnali.
- Evita l'Overtrading: Usa le divergenze come parte di una strategia più ampia, non in isolamento.
- Rimani Aggiornato: Controlla aggiornamenti del codice o feedback della community sui forum di cTrader.
⚠️ Problemi Comuni e Soluzioni
- Nessun Segnale Visualizzato:
-
- Controlla
MinCountDivergenceShowrispetto aLookBack(il primo deve essere ≤ del secondo). - Assicurati che
PeriodFractalsia dispari.
- Controlla
- Troppi Segnali:
-
- Aumenta
MinCountDivergenceShowo riduciLookBack. - Stringi
MinBarsValidationeMaxBarsValidation.
- Aumenta
- Messaggi di Errore:
-
- Rivedi gli avvisi sui parametri nell'area dell'indicatore (ad esempio,
MinBarsValidation > MaxBarsValidation). - Correggi le impostazioni non valide e riapplica l'indicatore.
- Rivedi gli avvisi sui parametri nell'area dell'indicatore (ad esempio,
🎉 Conclusione
L'indicatore Divergency v1.1 è uno strumento versatile e robusto per gli utenti di cTrader, offrendo approfondimenti approfonditi sulle relazioni prezzo-oscillatore. Con le sue impostazioni personalizzabili e output visivi chiari, permette ai trader di individuare inversioni, continuazioni e forza del trend con fiducia. Provalo, modifica i parametri e integralo nel tuo piano di trading per elevare la tua analisi! 🚀
Buon trading, e che i tuoi grafici siano sempre verdi! 📈💚
Riepilogo
- Regular divergences signaling potential reversals when price and oscillator move oppositely.
- Hidden divergences indicating trend continuation with differing price and oscillator alignments.
- Correlations highlighting synchronized movements suggesting trend strength.
Signals are displayed on the chart and indicator window using colored lines, icons, and text for clarity. Visual cues include trend lines connecting divergence points and arrows indicating signal direction. Key functions handle initialization, calculation of normalized oscillator values, fractal detection, divergence analysis, and drawing of signals.
Users can configure overbought/oversold zones and adjust lookback periods to tailor signal sensitivity. The indicator works on any timeframe, with higher timeframes recommended to reduce noise. It includes error handling for invalid parameters and provides guidance for installation, parameter setup, signal interpretation, and trading strategies such as reversal and trend continuation. Backtesting and parameter optimization are supported within cTrader to refine performance.
Recensioni dei clienti
5 | 100 % | |
4 | 0 % | |
3 | 0 % | |
2 | 0 % | |
1 | 0 % |


