説明
⚠️ 移動しました 👉 PrimeQuant
🚫🚫🚫 このインジケーターを購入しないでください!
この OHLC PRO by LudwigICT インジケーターは、多機能チャートオーバーレイツールで、cTraderチャート上にプロフェッショナルで情報豊富なビジュアライゼーションを提供するよう設計されています。
以下はその機能の概要です:
🔹 コア機能:OHLCオーバーレイ
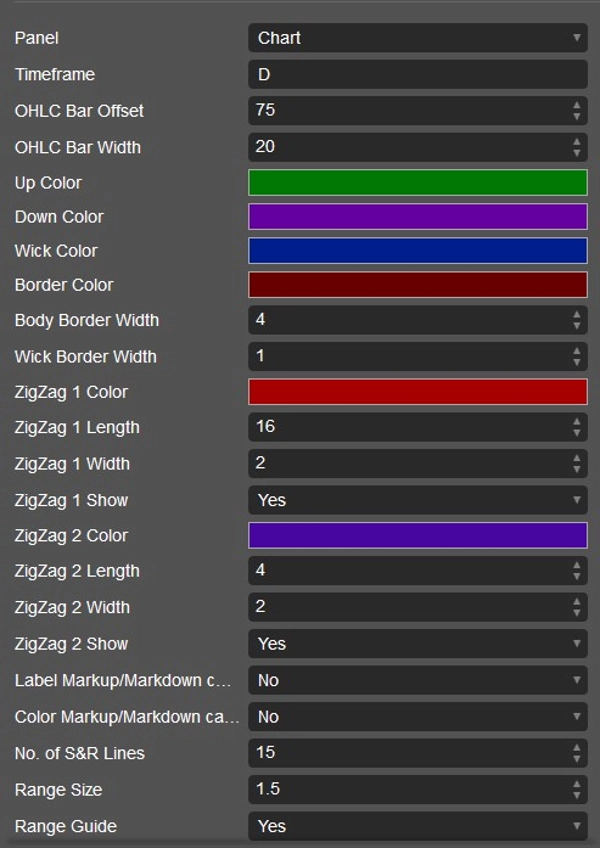
- チャート上に カスタムOHLC(始値、高値、安値、終値)バーを描画します。
- 以下を設定できます:
-
- 使用する時間枠のOHLC(日次、週次、月次、またはH1、M15などのインターデイ)。
- バーのオフセット(現在のローソク足からの距離)。
- バーの幅、ヒゲ、境界線、カスタムカラー。
- 実質的に、現在のチャート上に高時間枠の “参照ローソク足”を配置できます。
🔹 トリプルMセットアップ(強気/弱気シグナル)
- 連続した高値安値のパターンを検出します(強気の 高値更新または弱気の 安値更新)。
- 検出時:
-
- ローソク足に 三角形アイコン(上向きまたは下向き)を配置できます。
- バーの色を 変更してモメンタムの変化を示すこともできます。
- これは モメンタム構造の変化シグナルとして機能します。
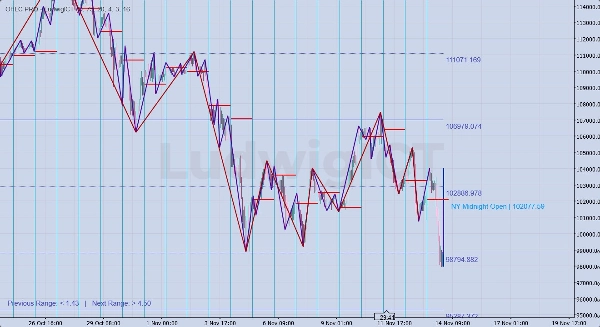
🔹 デュアルジグザグツール
- 2つの独立したジグザグオーバーレイ:
-
- ジグザグ #1(長い期間、例:スイング構造)。
- ジグザグ #2(短い期間、例:マイクロスイング)。
- 市場のスイングを 構造、トレンド、ブレイクアウト分析のために強調表示します。
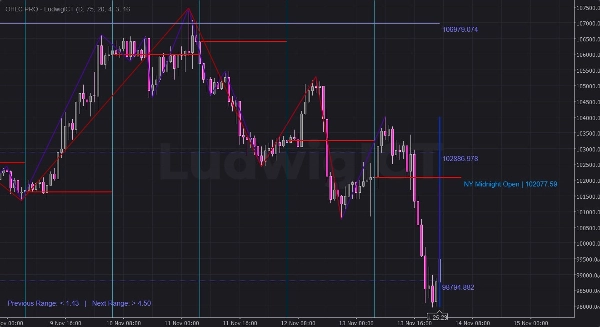
🔹 ギャンのサポート&レジスタンス
- ギャン数表+ATRロジックを使用してS/Rレベルを計算します。
- 価格の上下に複数のサポート/レジスタンスラインをプロットします。
- ラインはスタイル設定可能(実線、点線、左方向延長など)。
- 価格値でレベルにラベルを付けます。
- また、レンジガイドも提供します:
-
- ATRに対する「前のレンジ」と「次のレンジ」の比較。
- 拡大または収縮ゾーンの予測に役立ちます。
🔹 ニューヨークミッドナイトレベル
- 自動的に ニューヨークセッションの真夜中の始値を検出します。
- 以下を描画します:
-
- 水平線をNY真夜中の始値に引きます。
- 垂直線をセッション開始時に引きます。
- 「NY Midnight Open | 価格」のラベルを表示します。
- これらの線は1日または2日間延長したり、追加の時間を加えることができます。
- ICTスタイルのトレーディング(ニューヨークセッションのバイアス、均衡点など)に役立ちます。
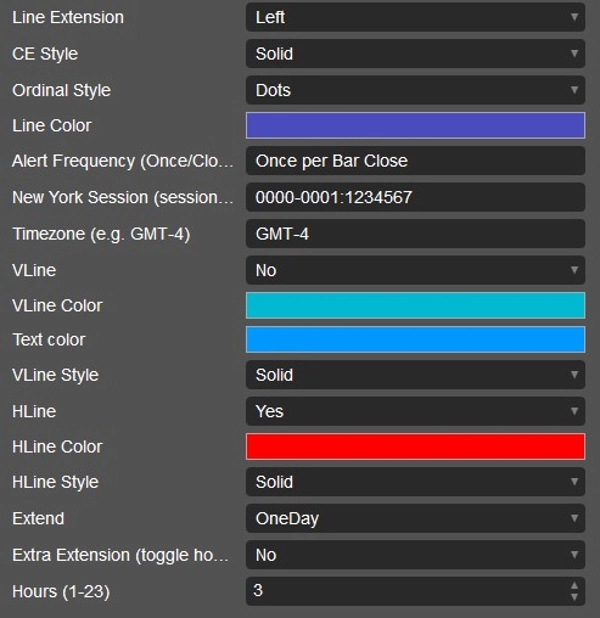
🔹 カスタマイズ&アラート
- すべての機能に ドロップダウンでパラメーター設定があります:
-
- 色、スタイル、ラインの延長、ライン数など。
- アラートもサポートされています(主にチャートの視覚的表示を通じて—アラート頻度パラメーターもあります)。
- インジケーター終了時にクリーンに削除され、チャートが散らかりません。
✅ 要するに:
このインジケーターは 多目的なプライスアクションツールです。以下を組み合わせています:
- 高時間枠のOHLCローソク足
- モメンタムパターンシグナル(トリプルM)
- 2つのジグザグ構造
- ギャンのS/Rレベル+レンジガイド
- ニューヨークセッションの真夜中の始値マーカー
これは 構造、セッション、レベルベースのトレーディング向けに作られており、特にICTスタイルやプライスアクショントレーダーに有用です。
XAU/USD取引時に実際に使う方法を説明します
🔹 実践的な取引利用(OHLC PROを使ったゴールド)
1. 高時間枠OHLCオーバーレイ
- 例:M5/M15で取引中に 日次OHLCをプロット。
- 前日のローソク足がインターデイチャート内に表示されます。
- 使い方:
-
- 価格が 前日の高値/安値に接近=流動性狩りエリア。
- 日次の始値/終値=バイアスフィルター(上なら強気、下なら弱気)。
- 日次レンジ内での取引に役立ちます。
👉 ゴールドでは、NYセッションがよく 前日の高値/安値を襲撃してから反転します。
2. トリプルMシグナル
- トリプルMパターン(上昇する安値または下降する高値の連続)=短期モメンタム。
- 使い方:
-
- 強気のトリプルMは サポート付近(高時間枠の安値またはNY真夜中の始値)→ロングのスキャルピングの可能性。
- 弱気のトリプルMは レジスタンス付近(高時間枠の高値またはギャンレベル)→ショートのスキャルピングの可能性。
- 急速なゴールドの動きでバーの色を変えて視覚的に認識しやすくできます。
👉 高時間枠のバイアスと合致すると、M1〜M5での 狙撃的なエントリーに効果的です。
3. デュアルジグザグ
- ジグザグ #1(長い期間)=スイング構造。
- ジグザグ #2(短い期間)=マイクロ構造。
- 使い方:
-
- 市場構造のブレイク(BOS/CHOCH)を特定します。
- 大きいジグザグ(#1)の方向にのみ取引します。
- 小さいジグザグ(#2)をエントリー確認に使用します。
👉 例:日次バイアスが強気の場合 → 高時間枠サポート付近でジグザグ #2が強気にシフトするのを待ちます。
4. ギャンのサポート&レジスタンス
- 数学的な S/Rレベルのグリッドを生成します。
- 使い方:
-
- 価格がレンジ内で推移している場合、レベルは拡大ブレイクアウトポイントを示します。
- ATRレンジガイドと組み合わせて:
-
- 「前のレンジ」が小さい → ボラティリティの拡大を予想。
- 「次のレンジ」が大きい → 強いブレイクアウトレベルが近い。
👉 ゴールドでは、ギャンレベルはしばしばキリの良い数字(例:2400、2420、2435)と一致します。
5. ニューヨークミッドナイトオープン
- これはゴールドにとって最も強力な ICTツールの一つです。
- 使い方:
-
- 価格がNYミッドナイトオープンに対してどの位置にあるか=方向性バイアス。
- 価格が ミッドナイトオープンの上にある場合 → 強気のNYセッション。
- 下にある場合 → 弱気バイアス。
- 水平線は 均衡(50%)の基準として機能します。
- ロンドン/NYのキルゾーンでこのレベル周辺の流動性スイープに注目してください。
👉 例:
NYミッドナイトオープン=2405。
- ロンドンが価格を2398まで下げ、NYが2405を回復した場合 → 強力なロングセットアップ。
🔑 まとめ(セットアップ例)
- NYセッション開始:
-
- 日次OHLCをプロット。
- NYミッドナイトオープンに注目。
- 近くのギャンレベルを監視。
- 流動性の獲得(デイリーハイ/ローまたはギャンSRの襲撃)を待つ。
- マイクロの強気/弱気確認のためにトリプルM / ジグザグ #2をチェック。
- 流動性スイープの後ろにストップを置いてエントリー。
- レンジの反対側または次のギャン/高時間枠レベルをターゲットに。
✅ 要するに:
- 日次OHLC+NYミッドナイト=バイアスフィルター。
- ジグザグ+トリプルM=エントリータイミング。
- ギャン+レンジガイド=利益目標&拡大シグナル。
このインジケーターは基本的に XAU/USD向けのすべてのICTスタイルツールを一つにまとめたものです。
ご質問や問題があれば、遠慮なくご連絡ください。喜んでお手伝いします!
免責事項:
私のアルゴリズムを使用することで、トレーディングには固有のリスクが伴い、過去のパフォーマンスが将来の結果を保証しないことを認識したものとみなされます。堅実なリスク管理戦略を持ち、特にストップロスレベルを守る規律を保つことが不可欠です。リスク管理を怠ると重大な損失につながる可能性があります。これらのアルゴリズムの使用による財務結果について私は責任を負いません。責任を持って取引し、常に適切なリスク管理を実践してください。
祝福を! 🙌
概要
カスタマーレビュー
5 | 100 % | |
4 | 0 % | |
3 | 0 % | |
2 | 0 % | |
1 | 0 % |


