Описание
Индикатор TrendFibonacci предназначен для помощи трейдерам в точном определении критических уровней цен и рыночных трендов. Интегрируя уровни коррекции Фибоначчи с Взвешенной Скользящей Средней (WMA) и Средним Истинным Диапазоном (ATR), этот индикатор предоставляет четкое визуальное отображение поддержки, сопротивления и направления тренда.
Основные характеристики:
- Динамические уровни Фибоначчи: Автоматически рассчитывает и отображает уровни коррекции Фибоначчи (по умолчанию: 0.382 и 0.618) на основе максимума и минимума за выбранный пользователем период.
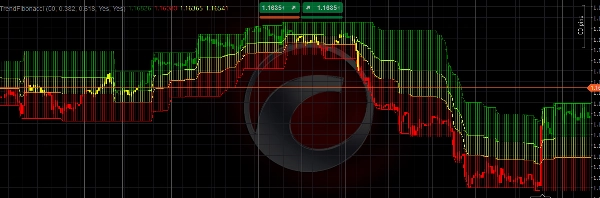
- Взвешенная скользящая средняя (WMA): Использует 6-периодную WMA для оценки направления тренда, с цветными свечами (зеленый для бычьего, красный для медвежьего, желтый для нейтрального) для отражения положения WMA относительно уровней Фибоначчи.
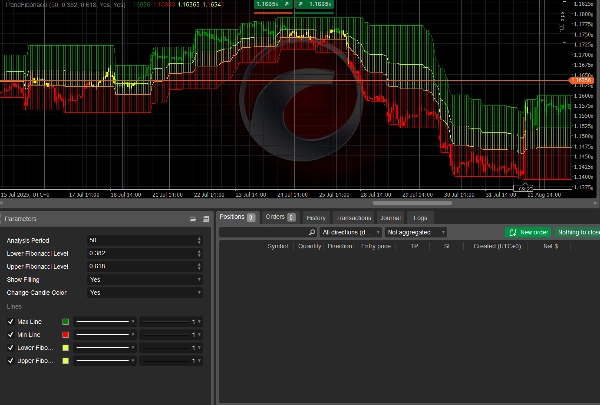
- Настраиваемые параметры: Регулируйте период анализа, уровни Фибоначчи и включайте/отключайте функции, такие как заполненные зоны и изменение цвета свечей.
- Визуальная ясность: Отображает линии максимумов/минимумов и заполняет области между уровнями Фибоначчи полупрозрачными цветами для удобного определения тренда.
- Интеграция ATR: Включает 200-периодный ATR для надежного анализа рынка, обеспечивая адаптацию к волатильности.
Этот индикатор идеально подходит для трейдеров, стремящихся сочетать анализ Фибоначчи с стратегиями следования за трендом. Независимо от того, торгуете ли вы на форекс, акциями или товарами, TrendFibonacci улучшает вашу способность выявлять ключевые зоны разворота и принимать обоснованные торговые решения.
Как использовать
- Установите индикатор:
-
- Добавьте индикатор TrendFibonacci на вашу платформу cTrader, загрузив исходный код или скачав его с маркетплейса.
- Настройте параметры:
-
- Период анализа: Установите период анализа (по умолчанию: 50 баров) для определения диапазона расчета максимумов/минимумов.
- Нижний уровень Фибоначчи: Отрегулируйте нижний уровень коррекции Фибоначчи (по умолчанию: 0.382).
- Верхний уровень Фибоначчи: Отрегулируйте верхний уровень коррекции Фибоначчи (по умолчанию: 0.618).
- Показать заполнение: Включите/отключите заполненные зоны между уровнями Фибоначчи (по умолчанию: включено).
- Изменение цвета свечей: Включите/отключите цветные свечи в зависимости от положения WMA (по умолчанию: включено).
- Интерпретируйте индикатор:
-
- Зеленые свечи: Указывают на бычий тренд, когда WMA находится выше верхнего уровня Фибоначчи.
- Красные свечи: Сигнализируют о медвежьем тренде, когда WMA находится ниже нижнего уровня Фибоначчи.
- Желтые свечи: Означают нейтральную зону, когда WMA находится между уровнями Фибоначчи.
- Заполненные зоны: Визуализируют ключевые ценовые зоны между линиями максимумов/минимумов и уровнями Фибоначчи для анализа поддержки/сопротивления.
- Применение в торговле:
-
- Используйте индикатор для определения потенциальных точек входа/выхода на уровнях Фибоначчи.
- Комбинируйте с другими техническими инструментами (например, RSI, MACD) для подтверждения.
- Отслеживайте цветные свечи для оценки силы и направления тренда.
- Лучшие практики:
-
- Тестируйте индикатор на демо-счете, чтобы ознакомиться с его поведением.
- Настраивайте параметры в соответствии с вашим стилем торговли и рыночными условиями.
- Используйте на более высоких таймфреймах (например, H1, H4) для более надежных сигналов.
Индикатор TrendFibonacci является универсальным инструментом для трейдеров всех уровней, предлагая четкие и практические инсайты о рыночных трендах и ценовых уровнях.
Сводка
Users can customize parameters such as the analysis period, Fibonacci levels, and visual features like filled zones between Fibonacci levels and candle color changes. The indicator visually highlights support and resistance zones by plotting high/low lines and filling areas between Fibonacci levels with semi-transparent colors. It is applicable across various markets including forex, stocks, commodities, and popular symbols like BTCUSD, EURUSD, GBPUSD, and XAUUSD.
TrendFibonacci supports traders in spotting potential entry and exit points at Fibonacci levels and can be combined with other technical tools like RSI and MACD for confirmation. It is recommended for use on higher timeframes (e.g., H1, H4) to enhance signal reliability.