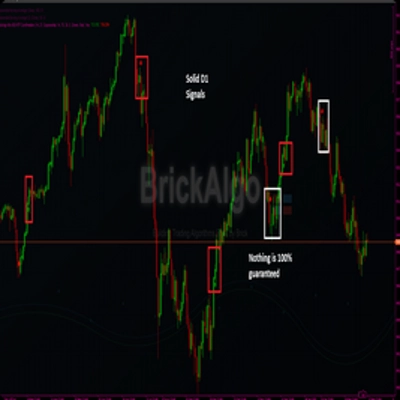
Описание
Определите зоны ВЫСОКОГО ИНСТИТУЦИОНАЛЬНОГО ИНТЕРЕСА: Там, где БОЛЬШЕ ОБЪЁМА в прорывах, там БОЛЬШЕ УЧАСТИЯ КРУПНЫХ ИГРОКОВ.
• ⚖️ Измерьте РАВНОВЕСИЕ СИЛ: Посмотрите, доминирует ли ПОКУПАТЕЛЬСКОЕ или ПРОДАВЛЕННОЕ ДАВЛЕНИЕ в каждой ценовой зоне
• 🎯 Обнаружьте КЛЮЧЕВЫЕ УРОВНИ: Зоны с БОЛЬШИМ ОБЪЁМОМ ПРОРЫВОВ часто выступают как БУДУЩАЯ ПОДДЕРЖКА/СОПРОТИВЛЕНИЕ
• ✅ Подтвердите движения: Прорыв с ВЫСОКИМ ОБЪЁМОМ имеет БОЛЬШУЮ ВЕРОЯТНОСТЬ быть подлинным
https://chartshots.spotware.com/c/6941a3f65f376
📈 КАК ЭТО ЧИТАТЬ?
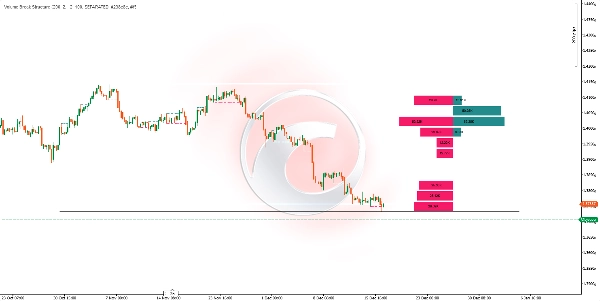
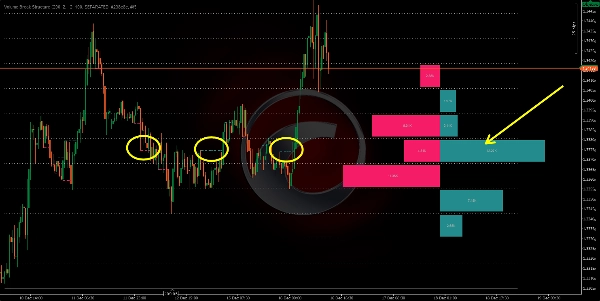
📊 Горизонтальные линии
• Каждая линия отмечает уровень, где произошёл ПРОРЫВ СТРУКТУРЫ
• 🟢 БЫЧЬИ прорывы
• 🔴 МЕДВЕЖЬИ прорывы
📈 Гистограмма
• Расположена с ПРАВОЙ СТОРОНЫ ГРАФИКА
• Разделена на СТРОКИ, представляющие РАВНЫЕ ЦЕНОВЫЕ ДИАПАЗОНЫ
• 📗 Столбцы давления ПОКУПАТЕЛЕЙ: НАКОПЛЕННЫЙ объём бычьих прорывов в этой зоне
• 📕 Столбцы давления ПРОДАВЦОВ: НАКОПЛЕННЫЙ объём медвежьих прорывов в этой зоне
• ⬆️ Размер столбца: БОЛЬШИЙ размер указывает на БОЛЬШИЙ ОБЪЁМ прорывов на этом уровне
https://chartshots.spotware.com/c/6941a4346ede0
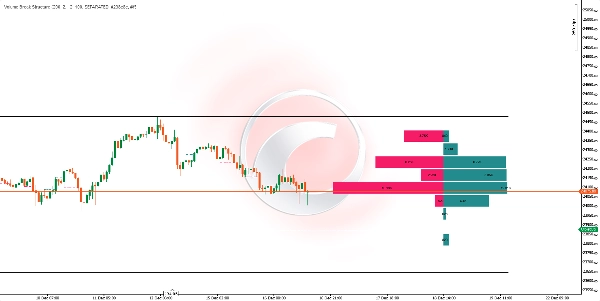
🟦 Сетка
• СПЛОШНЫЕ верхняя и нижняя линии отмечают МАКСИМАЛЬНЫЙ и МИНИМАЛЬНЫЙ ДИАПАЗОН анализируемого периода
• ПУНКТИРНЫЕ линии делят этот диапазон на РАВНЫЕ ЧАСТИ для удобства чтения
⚙️ 🔧 ОСНОВНЫЕ ПАРАМЕТРЫ
ПараметрФункция
🕯️ Количество свечей для расчёта
Количество свечей, которые анализируются НАЗАД
🎚️ Длина колебания
ЧУВСТВИТЕЛЬНОСТЬ для обнаружения поворотных точек (ВЫШЕ = меньше сигналов, БОЛЕЕ НАДЁЖНО)
📊 Количество строк гистограммы
Количество ДЕЛЕНИЙ/СТРОК в гистограмме
📏 Ширина гистограммы
ВИЗУАЛЬНАЯ ШИРИНА гистограммы
👁️ Режим отображения
РАЗДЕЛЁННЫЙ (покупка/продажа) или АГРЕГИРОВАННЫЙ (общий объём)
🔄 КОГДА ОБНОВЛЯЕТСЯ?
🕒 Индикатор АВТОМАТИЧЕСКИ ПЕРЕСЧИТЫВАЕТСЯ при ЗАКРЫТИИ каждой свечи, включая любой НОВЫЙ ПРОРЫВ СТРУКТУРЫ который произошёл.
💡 🤝 КАК ЭТО СОЧЕТАТЬ?
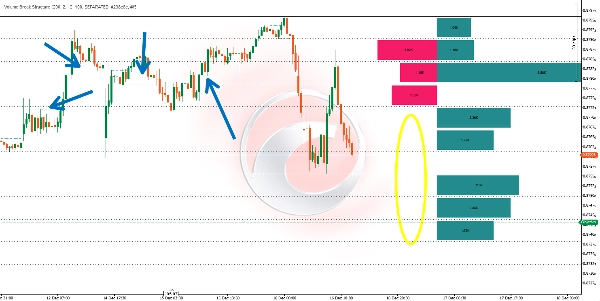
📈 С АНАЛИЗОМ ТРЕНДА
• В ВЫСХОДЯЩЕМ ТРЕНДЕ ищите зоны, где ДОМИНИРУЕТ ОБЪЁМ ПОКУПАТЕЛЬСКОГО ДАВЛЕНИЯ для потенциальных входов на ОТКАТАХ
• В НИЖАЮЩЕМ ТРЕНДЕ ищите зоны, где ДОМИНИРУЕТ ОБЪЁМ ПРОДАВЛЕННОГО ДАВЛЕНИЯ для потенциальных входов на ОТБОЯХ
🛡️ С ПОДДЕРЖКОЙ и СОПРОТИВЛЕНИЕМ
• Уровни с НАИБОЛЬШИМ ОБЪЁМОМ ПРОРЫВОВ часто становятся БУДУЩИМИ ЗОНАМИ РЕАКЦИИ
• Используйте гистограмму, чтобы определить зоны, наиболее "ЗАЩИЩАЕМЫЕ" покупателями или продавцами
🌊 С ПОТОКОМ ЗАКАЗОВ
• ПОДТВЕРДИТЕ показания гистограммы с помощью ИНСТРУМЕНТОВ ПОТОКА ЗАКАЗОВ В РЕАЛЬНОМ ВРЕМЕНИ
• Зоны с высоким объёмом прорывов часто совпадают с ЗОНАМИ ИНСТИТУЦИОНАЛЬНОГО ПОГЛОЩЕНИЯ
🕯️ С ЦЕНОВЫМ ДЕЙСТВИЕМ
• Ищите СВЕЧНЫЕ ПАТТЕРНЫ в зонах, где гистограмма показывает ЗНАЧИТЕЛЬНЫЙ ДИСБАЛАНС
• ПАТТЕРН РАЗВОРОТА в зоне ВЫСОКОГО ПОКУПАТЕЛЬСКОГО ДАВЛЕНИЯ имеет БОЛЬШУЮ ВЕРОЯТНОСТЬ УСПЕХА
🎯 🚀 БЫСТРАЯ ИНТЕРПРЕТАЦИЯ
Визуальный сигналИнтерпретация
📗 Большой столбец ПОКУПАТЕЛЕЙ, 📕 маленький столбец продавцов
СИЛЬНАЯ ЗОНА СПРОСА, возможная ПОДДЕРЖКА
📕 Большой столбец ПРОДАВЦОВ, 📗 маленький столбец покупателей
СИЛЬНАЯ ЗОНА ПРЕДЛОЖЕНИЯ, возможное СОПРОТИВЛЕНИЕ
⚔️ Оба столбца БОЛЬШИЕ и похожие
ЗОНА БОЯ, ОЖИДАЕТСЯ ВЫСОКАЯ ВОЛАТИЛЬНОСТЬ
⏭️ Строка без столбцов
ЗОНА МАЛОГО ИНТЕРЕСА, цена прошла через неё БЫСТРО
ВАЖНЫЕ ЗАМЕЧАНИЯ
• ❌ Индикатор РАБОТАЕТ С ПОДТВЕРЖДЁННЫМИ ИСТОРИЧЕСКИМИ ДАННЫМИ; ОН НЕ ПРЕДСКАЗЫВАЕТ БУДУЩЕЕ
• 📊 БОЛЬШЕЕ количество свечей для расчёта = БОЛЕЕ ШИРОКИЙ ОБЗОР но может РАЗМЫВАТЬ НЕДАВНИЕ СИГНАЛЫ
• ⏰ Настраивайте длину колебания в зависимости от ТАЙМФРЕЙМА: БОЛЬШИЕ ЗНАЧЕНИЯ для ВЫСОКИХ ТАЙМФРЕЙМОВ
• 🛡️ ВСЕГДА СОЧЕТАЙТЕ С ПРАВИЛЬНЫМ УПРАВЛЕНИЕМ РИСКАМИ
Сводка
Key features include:
- Horizontal lines marking bullish (green) and bearish (red) structure breaks.
- A histogram on the right side of the chart divided into rows representing equal price ranges, showing accumulated volume of bullish and bearish breaks. Larger bars indicate higher volume.
- A grid marking the maximum and minimum price range of the analyzed period, divided into equal sections for easier reading.
The indicator recalculates automatically at the close of each candle, updating with any new structure breaks. Main adjustable parameters include the number of bars analyzed backward, swing length sensitivity for pivot detection, histogram rows, histogram width, and display mode (separated buy/sell or aggregated volume).
Volume Break Structure can be combined with trend analysis, support and resistance levels, order flow tools, and price action patterns to confirm market movements and identify potential entry points. It works with confirmed historical data and does not predict future price action.
Отзывы покупателей
5 | 0 % | |
4 | 100 % | |
3 | 0 % | |
2 | 0 % | |
1 | 0 % |