
SUPER TREND OSCILLATOR TRIAL DAY15
インジケーター
43 ダウンロード数
バージョン 1.0、Nov 2025
Windows、Mac
4.0
レビュー: 1

説明
SUPER TREND OSCILLATOR TRIAL DAY15
「注意」、有料版には無料の15日間トライアル版も利用可能です。有料製品をクリックすると無料版が見つかります-
簡略化されたSuperTrendオシレーター - 完全な説明
概要
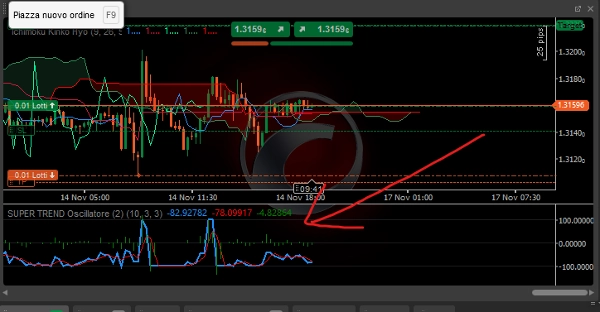
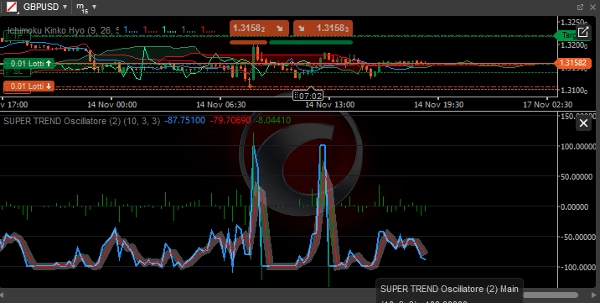
簡略化されたSuperTrendオシレーター cTrader用の高度なテクニカル指標で、クラシックなSuperTrendを視覚的なオシレーターに変換し、トレンドの方向、強さ、信頼性を簡単に識別できます。
主な構成要素
1. メインライン(青)
- 機能: 価格とSuperTrendライン間の正規化された距離を表示
- 計算:
((Price - SuperTrend) / (ATR × Multiplier)) × 100 - 解釈:
-
- > 0: 強気トレンド(価格がSuperTrendの上)
- < 0: 弱気トレンド(価格がSuperTrendの下)
- 範囲: -100から+100まで
2. シグナルライン(赤)
- 機能: メインラインの単純移動平均
- 期間: カスタマイズ可能(デフォルト3期間)
- 使用法: 市場のノイズをフィルタリングし、シグナルを確認
3. ヒストグラム(灰色)
- 機能: メインラインとシグナルラインの差
- 解釈:
-
- ポジティブ: 強気の勢いが加速
- ネガティブ: 弱気の勢いが加速
- ゼロクロスオーバー: 勢いの反転の可能性
設定可能なパラメータ
SuperTrendパラメータ:
- ATR期間: 平均真の範囲計算の期間(デフォルト: 10)
- 乗数: SuperTrendバンドの乗数(デフォルト: 3.0)
オシレーターのパラメータ:
- シグナル期間: シグナルラインの期間(デフォルト: 3)
シグナルの解釈
トレンド条件:
- 強い強気トレンド:
-
- メイン > +50
- メイン > シグナル
- ポジティブなヒストグラム
- 強い弱気トレンド:
-
- メイン < -50
- メイン < シグナル
- ネガティブなヒストグラム
- レンジ相場:
-
- メインが-30から+30の間
- 頻繁なラインのクロスオーバー
取引シグナル:
ロングエントリー:
- メインが0を上抜ける
- ヒストグラムがポジティブに変わる
- シグナルラインが強気を確認
- 勢いのためにメインが+20以上
ショートエントリー:
- メインが0を下抜ける
- ヒストグラムがネガティブに変わる
- シグナルラインが弱気を確認
- 勢いのためにメインが-20以下
エグジット/利益確定:
- ロング: メイン > +80(買われ過ぎ)またはシグナルを下回るクロス
- ショート: メイン < -80(売られ過ぎ)またはシグナルを上回るクロス
簡略版の利点
1. 最適化されたパフォーマンス
- より効率的な計算
- リソース消費の低減
- 価格変動への迅速な反応
2. 使いやすさ
- 必要なパラメータの削減
- 即時の視覚的シグナル
- 初心者トレーダーでも簡単に解釈可能
3. 信頼性
- ノイズに対する耐性向上
- よりクリーンで明確なシグナル
- クラシックなSuperTrendと比べて誤シグナルの減少
使用戦略
トレンドフォロー戦略:
- エントリー: ロングはメイン > 0、ショートはメイン < 0
- フィルター: ヒストグラムはメインと同じ符号
- エグジット: 符号の反転または極端なレベル到達
モメンタム戦略:
- エントリー: ロングはメイン > +30、ショートはメイン < -30
- 確認: ヒストグラムが加速中
- エグジット: 勢いの減速(ヒストグラムの減少)
平均回帰戦略:
- エントリー: ショートはメイン > +80、ロングはメイン < -80
- 確認: ヒストグラムの反転
- エグジット: 中立ゾーンへの回帰
最適な市場条件
トレンド市場:
- 高い効率性
- 長時間のシグナル
- ホイップソーの減少
レンジ市場:
- ロットサイズを減らす
- タイムフレームを延長
- モメンタムフィルターとして使用
ベストプラクティス
推奨タイムフレーム:
- 日中取引: M15 - H1
- スイングトレード: H4 - D1
- ポジショントレード: W1 - MN
リスク管理:
- ストップロス: 1.5-2 × ATR
- 利益確定: 2-3 × リスク
- ポジションサイズ: 取引ごとに1-2%
追加の確認事項:
- 複数タイムフレームの整合性
- 出来高の確認
- 主要なサポート/レジスタンスレベル
制限事項
考慮点:
- 固有の遅延(トレンドフォロー指標)
- レンジ市場でのパフォーマンス低下
- 低ボラティリティ時の確認の必要性
推奨事項:
- プライスアクション分析と組み合わせる
- 単独システムではなくフィルターとして使用
- ライブ使用前にデモテストを行う
このオシレーターは、強いトレンドを識別し誤シグナルをフィルタリングする強力なツールであり、初心者から経験豊富なトレーダーまで操作の簡単さを維持しています。
概要
インジケーターのプロフィール
カスタマーレビュー
4.0
レビュー: 1
5 | 0 % | |
4 | 100 % | |
3 | 0 % | |
2 | 0 % | |
1 | 0 % |
カスタマーレビュー
November 24, 2025
Super Trend Oscillator combines trend direction with momentum, giving clean color-coded signals and smooth transitions. Great for timing entries and filtering noise across all timeframes. Trial version works well but lacks alerts. Full version would shine with notifications and extended filters.
ディスカッション
よくあるご質問
BTCUSD
Forex
Signal
EURUSD
Commodities
GBPUSD
XAUUSD
cTrader Storeで入手可能な取引ボット、インジケーター、プラグインなどの商品は、第三者の開発者が提供するものであり、情報と技術の取得のみを目的としてご利用いただけます。cTrader Storeはブローカーではなく、投資助言や個人的な推奨を行うことも、将来のパフォーマンスを保証することもありません。
この作成者の他の商品


価格
12
販売
1.49K
無料インストール