説明
🚀 10,000人以上のトレーダーがすでに私たちのTOP インジケーター🏆
👉 すべてのTOPシステムはこちらから入手できます:
_______________________________________________
📌 マーケット構造インジケーター
· ✅ AdvancedMarket Structure: Bos, Choch, SwinLevels, Order Blocks, Market Structure& Liquidity Finder
· 🔄 Dynamic Market StructureAnalysis of Turning Points
· 🧱 Order Block
· ⚖️ Market Imbalance
· ⛓️ BOS & CHOCH
· 🧠 ICT Power of 3
_______________________________________________
🔚 スマートエグジットシステム
_______________________________________________
📐 ジグザグインジケーター
· 🔍 ZigZag Price LiquidityProjection
· ➖ ZigZag
_______________________________________________
🧱 サポート&レジスタンスインジケーター
· 🟩 SmartTrend Support &Resistance Lines
· 🧱 All Support and ResistanceLevels
_______________________________________________
📊 トレンド&チャネルインジケーター
· 📊 Supertrend
_______________________________________________
💧 ボリューム&流動性ツール
_______________________________________________
⚡ モメンタム&RSIインジケーター
· 🔎 Multi-Level Candle Bias
Tracker
_______________________________________________
🔮 予測&投影ツール
· 📐 Prediction Based on Linreg& ATR
· 📏 Fibonacci Linear RegressionMulti-timeframe
· 📈 Volume-Powered Market Flow Projector
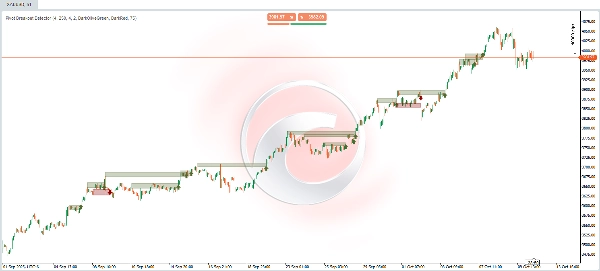
📊 ピボットブレイクアウトディテクター
🎯 **それは何で、何のためのものですか?**
https://ctrader.chartshots.net/c/68e935cb9f52a
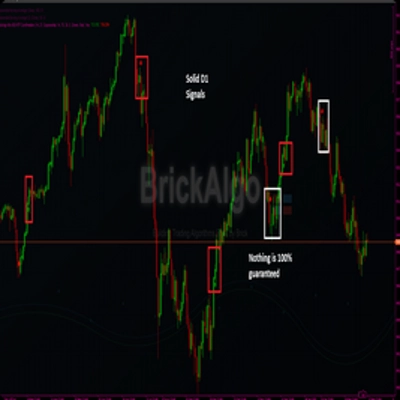
ピボットブレイクアウトディテクターは、価格の統合ゾーンからの重要なブレイクアウトを自動的に識別するために設計された高度なテクニカルインジケーターです。このインジケーターは、市場の過去の動きを分析し、価格が繰り返し「反発」した(抵抗または支持を形成した)エリアを検出し、勢いを伴うブレイクアウトが発生したときにアラートを出します。
**主な用途:**
• 確認されたブレイクアウトでの取引機会の特定
• 複数回のタッチ検証による偽のブレイクアウトの回避
• 重要な動的サポートおよびレジスタンスゾーンの視覚化
• 統合後の爆発的な動きを捉える
________________________________________
🔍 **仕組み - 基本的なロジック**
**フェーズ1:重要なピボットの検出**
https://ctrader.chartshots.net/c/68e9368eb6e7c
インジケーターはチャートを常にスキャンし、価格が方向を変えた局所的な高値と安値であるピボットポイントを探します。これらのピボットは、買い手または売り手の関心が歴史的にあったレベルを示すため、基本的なものです。
**フェーズ2:統合ゾーンの特定**
ピボットが検出されると、インジケーターはそれらが近接しているもの(設定可能な閾値内)をグループ化します。複数のピボットが狭い価格帯に集中している場合、これは統合ゾーンを示し、価格が繰り返し拒否されたエリアとなります。
**フェーズ3:ブレイクアウトの確認**
インジケーターは価格が以下を達成するまで辛抱強く待ちます:
1. 特定されたゾーンの上(強気のブレイクアウト)または下(弱気のブレイクアウト)で終値をつけること
2. 強い方向性のローソク足であること(始値から大きく離れて終値)
3. 最近の短期高値/安値を超えること
**フェーズ4:最終検証**
シグナルを生成する前に、以下を確認します:
• ゾーン内で十分な過去の「タッチ」があること(設定可能な最小値)
• 価格が最近そのレベルを超えていないこと
• ブレイクアウトローソク足の始値が有効範囲内にあること
________________________________________
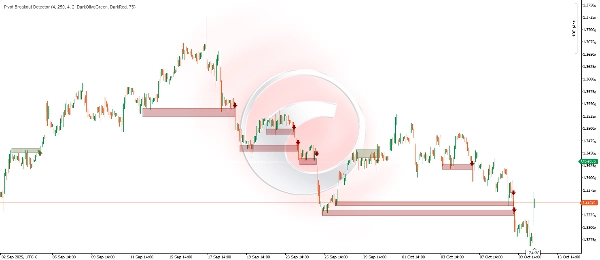
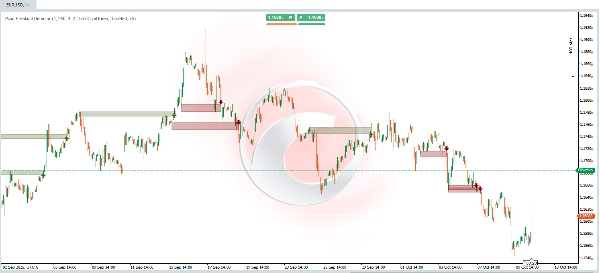
📈 **視覚的解釈**
**チャート上の要素:**
🟢 **オリーブグリーンの長方形(強気のブレイクアウト)**
• 緑色のシェードエリア:突破された抵抗エリアを表します
• 上下の境界線:以前の統合ゾーンを区切ります
• 水平方向の延長:ゾーンが形成された時点からブレイクアウトまでを示します
🔴 **ダークレッドの長方形(弱気のブレイクアウト)**
• 赤色のシェードエリア:破られたサポートエリアを表します
• 機能:緑の長方形と同様ですが、弱気の動きに対応します
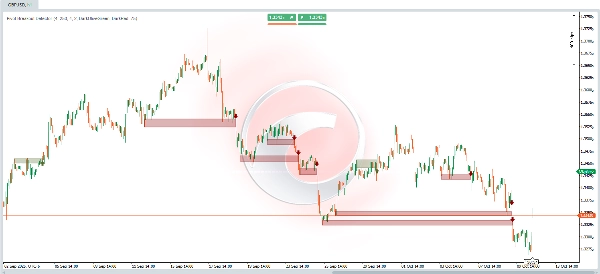
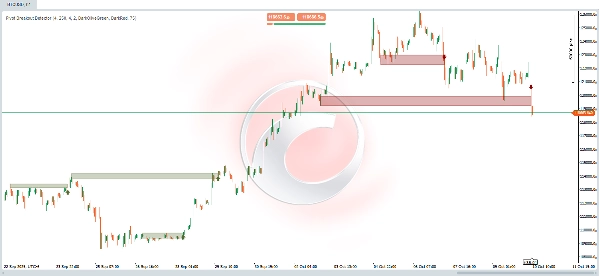
⬆️ **緑の上向き矢印**
• 場所:強気のブレイクアウトを確認したローソク足の下
• 意味:潜在的なロングエントリーシグナル(買い)
• 解釈:価格が力強く抵抗を突破したことを示します
⬇️ **赤の下向き矢印**
• 場所:弱気のブレイクアウトを確認したローソク足の上
• 意味:潜在的なショートエントリーシグナル(売り)
• 解釈:価格が力強くサポートを突破したことを示します
________________________________________
⚙️ **設定可能なパラメーター**
1. **スイング検出長さ(デフォルト:4)**
• 制御内容:重要なピボットを検出するための分析期間
• 低い値(2-3):より小さく頻繁なピボットを検出し、シグナルは多くなるが偽シグナルも増える可能性あり
• 高い値(7-10):主要でより信頼性の高いピボットのみを検出し、シグナルは少ないが質は高い
• 推奨:日中取引には4、スイングトレードには8-10
2. **ゾーン履歴バー(デフォルト:250)**
• 制御内容:インジケーターがゾーン形成のためにピボットを「記憶」する過去のローソク足数
• 低い値(30-100):最近のゾーンに焦点を当て、構造変化により反応的
• 高い値(200-300):古い歴史的ゾーンも考慮し、長期レベルの特定に有用
• 推奨:日中時間枠には150-200、日足以上には250-300
3. **ゾーン幅パーセント(デフォルト:4%)**
• 制御内容:ピボットをゾーンにグループ化するための「許容範囲」の厚さ
• 低い値(1-2%):非常に正確なゾーンで、ほぼ正確な複数のタッチが必要
• 高い値(5-8%):より広いゾーンで、近接レベルのグループ化に寛容
• 推奨:低ボラティリティの銘柄(主要通貨)には2-3%、暗号通貨には4-6%
4. **最小スイングタッチ数(デフォルト:2)**
• 制御内容:ゾーンを有効と見なす前に価格が「テスト」した最低回数
• 低い値(1-2):より多くのシグナル、確立されていないゾーンも含む
• 高い値(3-5):強く確認されたゾーンのみ、シグナルは少ないが信頼性は高い
• 推奨:アクティブトレードには2、より保守的なポジションには3-4
________________________________________
📊 **実践例**
🔵 **強気のブレイクアウト例**
**前提状況:** 価格は数セッションにわたり$48.50から$49.20の間で変動しています。この統合期間中、価格は3回にわたり$49.00レベルを突破しようとしましたが、毎回拒否され、ほぼ同じレベルで高いピボットを形成しました。
**ゾーン形成:** インジケーターは自動的にこれらの3つの高いピボットを$48.90から$49.10の間に集中していると認識し、明確な「抵抗ゾーン」を作成します。このゾーンは半透明のオリーブグリーンの長方形として描画され、最初のタッチから現在まで水平に延長されます。
**ブレイクアウトの瞬間:** 現在のセッションで、価格は$48.80で始まり、強く上昇して$49.35で終値をつけます。このローソク足はすべての基準を満たしています:
• ✅ 抵抗ゾーンの上で終値をつけている($49.10)
• ✅ 強い強気のローソク足である(始値よりかなり上で終値)
• ✅ 直近4本のローソク足の高値を超えている
• ✅ ゾーンには少なくとも2-3回の確認タッチがあった
**生成されたシグナル:** ブレイクアウトローソク足の下に上向きの緑の矢印が表示され、オリーブグリーンの長方形がその時点で「閉じ」、抵抗が形成された場所から破られた場所までの全構造を視覚的に示します。
**トレーダーの解釈:** これは潜在的な買いシグナルです。ブレイクアウトは、買い手が価格を抑えていた抵抗をついに突破したことを示し、より持続的な強気の動きが始まる可能性があります。トレーダーは以下を検討できます:
• ローソク足の終値または破られたゾーン(現在はサポート)へのプルバックでのロングエントリー
• ゾーンの下($48.70)にストップロスを設定
• ゾーンの高さを上方に投影した目標値
________________________________________
🔴 **弱気のブレイクアウト例**
**前提状況:** 価格は約2週間にわたり$102.00付近で分配フェーズにあります。4回にわたり価格は$101.50を下回ろうとしましたが、買い手に救われ、非常に狭いゾーンで低いピボットを形成しました。
**ゾーン形成:** インジケーターはこれら4つの低いピボットを$101.40から$101.70の間にグループ化し、明確な機関の「サポートゾーン」として識別します。このエリアは半透明の赤い長方形でマークされ、このレベルでの防御の全履歴を記録します。
**ブレイクアウトの瞬間:** 変動の激しいセッション中、価格は$101.80で始まり、ネガティブなニュースが市場に影響を与え、$100.95で終値をつけて急落します。このブレイクアウトローソク足は以下を示します:
• ✅ サポートゾーンの明確な下で終値をつけている($101.40)
• ✅ 強力な弱気のローソク足である(始値よりかなり下で終値)
• ✅ 直近4セッションの安値を破っている
• ✅ サポートは以前に4回テストされていた
**生成されたシグナル:** ブレイクアウトローソク足の上に下向きの赤い矢印が表示されます。ダークレッドの長方形が完成し、形成期間全体とサポート崩壊の正確なポイントを視覚的に記録します。
**トレーダーの解釈:** これは潜在的な売りシグナルです。ブレイクアウトは売り手が価格を支えていた床をついに破ったことを示し、弱気トレンドが継続する可能性を示唆します。考慮すべき点は:
• 終値または破られたゾーン(現在はレジスタンス)への失敗したプルバックでのショートエントリー
• ゾーンの上($102.00)にストップロスを設定
• ゾーンの高さを下方に投影した目標値
________________________________________
💡 **使用のヒント**
✅ **ベストプラクティス:**
1. ボリュームで確認:本物のブレイクアウトは通常、ボリュームの増加を伴います
2. トレンドの文脈:主要トレンドの方向へのブレイクアウトは成功確率が高いです
3. 待機時間:すべてのシグナルを即座に取引する必要はなく、必要に応じて追加の確認を待ちます
4. リスク管理:常に破られたゾーンの構造に基づいたストップロスを使用してください
概要
Key features include:
- Automatic detection of significant pivot points and consolidation zones.
- Breakout confirmation based on candle strength and price action.
- Validation requiring multiple prior touches of the zone to reduce false signals.
- Visual cues on the chart: olive green rectangles and upward arrows for bullish breakouts; dark red rectangles and downward arrows for bearish breakouts.
- Configurable parameters such as swing detection length, zone history depth, zone width, and minimum touches to tailor sensitivity and reliability.
The indicator supports various markets including Forex, cryptocurrencies, stocks, and major symbols like BTCUSD, EURUSD, GBPUSD, XAUUSD, and NAS100. It aids traders in spotting confirmed breakout opportunities, visualizing critical price levels, and managing risk with structural stop-loss placement.