present
新規登録で初回購入時に$50オフ
Trading product for Rate Of Change v6 インジケーター Signal, image 1
Rate Of Change v6
インジケーター
バージョン 1.0、Dec 2024
Windows、Mac
Trading product for Rate Of Change v6 インジケーター Signal, image 2
Trading product for Rate Of Change v6 インジケーター Signal, image 3
Trading product for Rate Of Change v6 インジケーター Signal, image 4
Trading product for Rate Of Change v6 インジケーター Signal, image 5
登録日 07/11/2024

説明

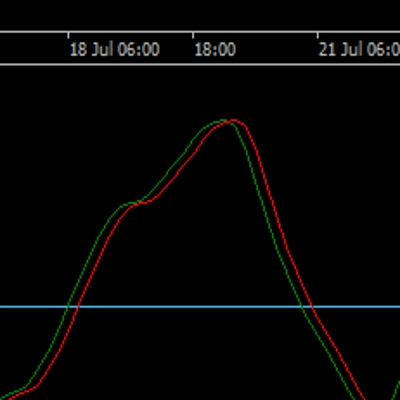
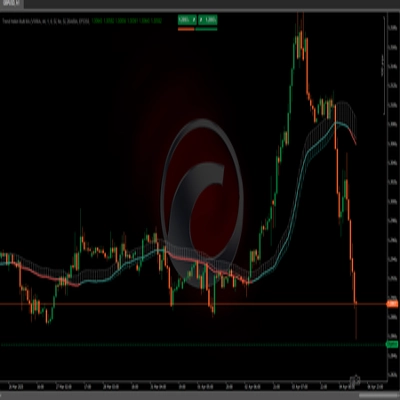
ROCは、方向性のある価格変動のトレンド継続パターンを識別する点で非常に効果的に機能します。時間枠と期間が長いほど、より明確なシグナルが生成されます。

以下のスクリーンショットで視覚的な説明をご覧ください

ユーザーは自己の裁量でインジケーターを使用するものとしますが、このインジケーターを使ってトップやボトムを選ぶことは推奨されません。なぜなら、最大逆行幅(Maximum Adverse Excursion)が長い時間枠ではかなり大きくなる可能性があるためです。理想的には、このインジケーターはトレンド継続のセットアップに使用されるべきです。

このインジケーターは手動でのポジションエントリーにも使用でき、自動取引ボットの開発に組み込むことも可能です。


インストールガイド

インジケーターの使用を開始するには、以下の手順に従ってください:

1.      <indicator_name>.algoファイルを、ローカルマシン上の他のすべてのインジケーターが保存されている場所にコピーします(通常はC:\Users\<user_Name>\Documents\cAlgo\Sources\Indicatorsです)。

2.      コピーが完了すると、インジケーターはカスタムインジケーター(Custom Indicators)メニューから選択可能になります。以下のスクリーンショットを参照してください

概要

AI summary
Rate Of Change v6 is a technical indicator designed to measure the intensity of price action changes, aiding in the identification of trend continuation patterns in directional price movements. It generates clearer signals on longer timeframes and periods, making it suitable primarily for trend continuation setups rather than for timing market tops or bottoms due to potentially significant maximum adverse excursions on extended timeframes. The indicator supports both manual position entries and integration into automated trading bots. Installation involves copying the indicator file to the local indicators directory, after which it becomes available under the Custom Indicators menu. This tool is tagged as a signal indicator, useful for generating trade entry signals based on price momentum changes.
インジケーターのプロフィール

カスタマーレビュー

0.0
レビュー: 0
カスタマーレビュー
この商品にはまだレビューがありません。お使いになったことがある方は、ぜひレビューをお願いします。

ディスカッション

よくあるご質問

Signal
cTrader Storeで入手可能な取引ボット、インジケーター、プラグインなどの商品は、第三者の開発者が提供するものであり、情報と技術の取得のみを目的としてご利用いただけます。cTrader Storeはブローカーではなく、投資助言や個人的な推奨を行うことも、将来のパフォーマンスを保証することもありません。
これも好きかも

「CandleCounterAlex」ロゴ
トップ評価
4.7
(4)
インジケーター
CandleCounterAlex – Candle Cycle Counter with Colors and Adjustable Position.
インジケーター
RSI
Breakout
+1
🚀 TrendHeikinMultiMA: Advanced trend detection using Heikin-Ashi smoothing & MAs! Eliminates noise, confirms real trend
インジケーター
RSI
SMC
+4
High Low Divergence is a clean, overlay indicator that automatically identifies swing highs and swing lows
インジケーター
Fisher Transform with smoothing. Spot reversals and cycles with precision. Great for any market, any timeframe.
インジケーター
AI
Forex
+7
Signal Strike is a professional trading indicator delivers clear, high‑confidence entry signals directly on your chart
インジケーター
VWAP
Volume
+5
Multi VWAP. Three timeframes. One clean chart. Your Essential Trading Tool.
インジケーター
XAUUSD
Commodities
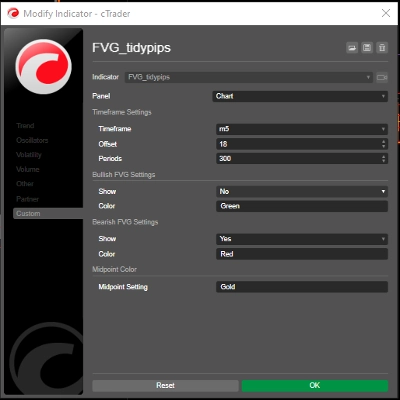
A Fair Value Gap (FVG) indicator that identifies potential price imbalances, potential reversal and continuation zones
「IVB 2.0」ロゴ
トップ評価
4.6
(5)
インジケーター
IVB 2.0 is an indicator that works on the strategy of imbalance of the maximum volatility box of indices
インジケーター
ATR
SMC
+2
HTF POWER 3 ICT Power of 3 · M1 Precision · H4 Intelligence Auto-detect Accumulation → Manipulation → Distribution
インジケーター
Overlay HTF context on any chart: color bars by HTF and draw filled HTF bodies with optional High/Low lines.
インジケーター
ATR
RSI
+1
Super Trend Rsi ,ATR + trend change distance + dynamic Alpha, divergence/convergence
インジケーター
AI
ATR
+27
Support and Resistance with signals
インジケーター
SMC
Prop
+13
Institutional FVG detection with HTF projection, precise volume deltas, and smart fill logic.
インジケーター
BOS
MSS
+5
WinSMC is an overlay SMC indicator for cTrader. It helps you visually identify!
インジケーター
AI
ATR
+20
Algorithmic trend precision for cTrader.
インジケーター
RSI
XAUUSD
+2
Automatic ZigZag swings with dynamic support & resistance levels, labeling highs/lows for clear trend signals.
インジケーター
Imbalance
Fair Value Gap
+1
Multi-symbol, multi-timeframe Fair Value Gaps in one panel.
インジケーター
RSI
RSI on the main chart with 45/55 momentum levels, overbought/oversold levels, averaged RSI, and multi-timeframe support.

価格

登録日 07/11/2024