

Deskripsi
🚀 Risk Appetite & Directional Bias ULTRA (cTrader) adalah indikator rezim pasar profesional yang dirancang untuk mengukur Risk-On / Netral / Risk-Off kondisi dan mengubahnya menjadi bias arah yang jelas dan dapat ditindaklanjuti. Alih-alih mengandalkan satu pasar, ini membandingkan dua instrumen (sebuah “proxy risiko” dan “tolok ukur”) untuk membangun Skor Risiko (0–100) secara waktu nyata, menyoroti transisi rezim, dan merangkum semuanya melalui tampilan dashboard di grafik.
🔧 Apa arti dua parameter pertama (dan mengapa penting)
🟠 Simbol Aset Risiko (BTC)
Ini adalah proxy risiko—instrumen yang digunakan sebagai “termometer selera risiko.” Ini diberi label “BTC” karena konsep asli menggunakan Bitcoin sebagai proxy risiko global, tetapi Anda tidak harus menggunakan Bitcoin. Anda dapat mengaturnya ke aset apa pun yang mewakili sentimen risiko dengan baik (misalnya, BTC, NASDAQ/US100, indeks beta tinggi, dll.).
🔵 Simbol Tolok Ukur (SP/US500)
Ini adalah pasar referensi (tolok ukur) yang ingin Anda lacak untuk bias makro. Biasanya US500/SPX500, tetapi bisa berupa instrumen apa pun yang Anda anggap sebagai “penggerak konteks” utama Anda.
✅ Singkatnya:
- Aset Risiko = sensor sentimen (sumber selera risiko)
- Tolok Ukur = pasar referensi yang ingin biasnya tercermin
❓ Apakah saya harus menggunakannya pada Bitcoin?
Tidak. Anda dapat menggunakan indikator ini dengan berbagai cara tergantung pada tujuan Anda:
✅ A) Risiko-On/Risiko-Off “klasik” makro (direkomendasikan)
- Aset Risiko: BTCUSD
- Tolok Ukur: US500 / SPX500
Ini memberikan pandangan yang jelas tentang rezim risiko global.
✅ B) Trading Bitcoin dengan konteks makro
- Aset Risiko: BTCUSD
- Tolok Ukur: US500 (atau referensi makro lain)
Ini membantu Anda memahami kapan kondisi makro mendukung atau menentang BTC.
✅ C) Hubungan pasar multi-aset / kustom
- Aset Risiko: BTC atau US100
- Tolok Ukur: pasar yang ingin Anda filter (GER40, XAUUSD, dll.)
Ini mengubah indikator menjadi “mesin sentimen” yang fleksibel.
⚙️ Cara kerjanya (logika inti)
Model menghitung hal berikut pada kedua simbol:
📈 Pengembalian (%) (opsional logaritmik untuk stabilitas lebih)
📊 Volatilitas (deviasi standar selama periode lookback yang dipilih)
🔗 Korelasi bergulir antara dua seri pengembalian
🎛️ Bobot Dinamis yang menyesuaikan pengaruh proxy risiko berdasarkan:
- kekuatan korelasi
- volatilitas relatif
Ini menghasilkan sinyal Perubahan yang Disesuaikan yang:
- dihaluskan dengan EMA
- dinormalisasi menjadi Skor Risiko 0–100
📊 Cara membacanya (sinyal terpenting)
🎯 Skor Risiko (0–100) adalah kompas utama Anda:
🟢 Risk-On (skor di atas ambang atas, misalnya, > 60)
→ selera risiko kuat, lingkungan sering mendukung momentum/aset risiko
🔵 Netral (antara ambang bawah dan atas, misalnya, 40–60)
→ transisi / sinyal campuran / chop, disarankan untuk memfilter
🔴 Risk-Off (skor di bawah ambang bawah, misalnya, < 40)
→ lingkungan defensif, kewaspadaan lebih tinggi, risiko penurunan sering meningkat
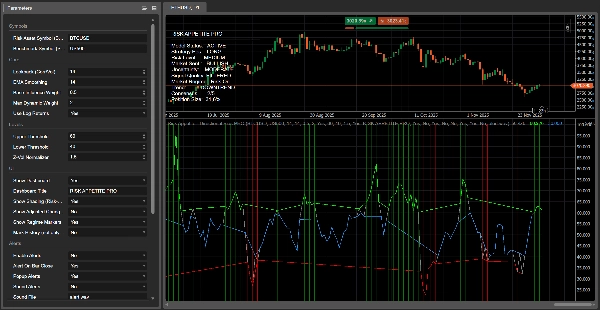
🔴 Mengapa garis merah “terputus” (dan apa artinya)
Dalam versi ULTRA ini visualisasi disengaja dan “berbasis rezim”:
- Sebuah garis dasar kontinu (abu-abu) selalu terlihat
- Overlay berwarna muncul hanya dalam rezimnya:
-
- Overlay merah hanya selama Risk-Off
- Overlay hijau hanya selama Risk-On
- Overlay biru selama Netral
Jadi ketika pasar meninggalkan Risk-Off dan bergerak ke Netral (atau Risk-On), overlay merah menjadi kosong (NaN) dan cTrader berhenti menggambarnya—itulah mengapa terlihat seperti “terputus.” ✅
📌 Penting: ini tidak secara otomatis berarti tren bearish “berakhir.”
Ini berarti model tidak lagi mendeteksi kondisi Risk-Off yang kuat dan terkonfirmasi, sehingga keunggulan bearish berkurang dan pasar kemungkinan dalam transisi.
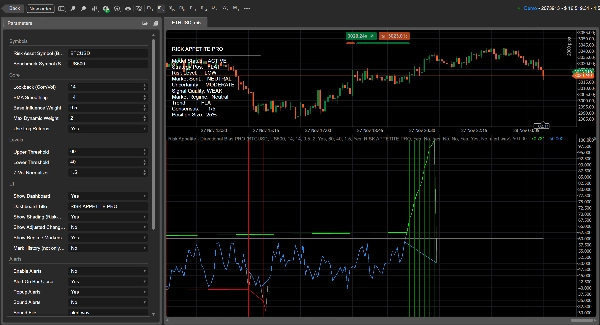
🖥️ Fungsi tampilan di grafik (dashboard) — dijelaskan baris per baris
Dashboard adalah panel keputusan waktu nyata Anda. Ini merangkum rezim, kepercayaan, dan panduan taktis sehingga Anda tidak perlu menebak hanya dari garis.
✅ Status Model
Menunjukkan apakah model berjalan dengan benar.
- AKTIF = data valid tersedia dan perhitungan benar
- TIDAK ADA DATA = data simbol hilang, nama simbol salah, atau sejarah/penyelarasan waktu tidak cukup
🎯 Posisi Strategi (Strategy Position)
Sikap yang disarankan berdasarkan rezim:
- LONG = Risk-On
- SHORT = Risk-Off
- FLAT = Netral
⚠️ Level Risiko
Ukuran intensitas risiko berdasarkan volatilitas pasar dan ketidakpastian.
- SANGAT RENDAH / RENDAH = kondisi lebih stabil
- SEDANG = normal
- TINGGI / SANGAT TINGGI = noise lebih tinggi, risiko whipsaw lebih tinggi; kurangi ukuran atau minta konfirmasi lebih kuat
🧠 Sentimen Pasar
Nada arah yang berasal dari tingkat skor:
- BULLISH / BEARISH / NETRAL
🌫️ Ketidakpastian
Menunjukkan seberapa “jelas” model. Ini meningkat ketika:
- korelasi melemah, atau
- volatilitas naik (lingkungan lebih tidak stabil)
Tingkat: RENDAH / SEDANG / TINGGI
🧪 Kualitas Sinyal
Penilaian gabungan berdasarkan:
- kekuatan sinyal (jarak dari 50)
- tingkat ketidakpastian
Output: KUAT / DIFILTER / LEMAH
🔥 Rezim Pasar
Klasifikasi utama:
- Risk-On / Netral / Risk-Off
Ini adalah status rezim inti yang menggerakkan overlay warna, bayangan, dan bias posisi.
📉 Tren
Arah jangka pendek dari skor (kemiringan):
- UPTREND = selera risiko meningkat
- DOWNTREND = selera risiko menurun
- FLAT = sideways / momentum rendah
🗳️ Konsensus (X/5)
Skor penyelarasan sederhana yang menghitung berapa banyak kondisi kunci yang setuju (arah, kemiringan, penyelarasan korelasi, dll.).
Semakin tinggi = lingkungan yang lebih bersih dan konsisten.
📏 Ukuran Posisi
Persentase eksposur yang disarankan berdasarkan kekuatan sinyal dan ketidakpastian:
- kuat & ketidakpastian rendah → saran ukuran lebih besar
- lemah atau tidak pasti → saran ukuran lebih kecil
🧭 Keuntungan multi-timeframe (sangat kuat dalam praktik)
Saat Anda menganalisis pasar yang sama di beberapa timeframe, indikator diperbarui dan diselaraskan ulang per timeframe. Ini memudahkan untuk melihat:
✅ Penyelarasan timeframe (sinyal lebih kuat)
✅ Konflik timeframe (sering kondisi lebih netral/campur)
Timeframe lebih tinggi menentukan rezim makro, timeframe lebih rendah membantu dengan penentuan waktu entri dalam rezim tersebut.
📌 Penanda, peringatan & notifikasi (fitur ULTRA)
✨ Penanda rezim dicetak di grafik saat rezim berubah:
- Risk-On ↔ Netral ↔ Risk-Off
Ini membuat transisi langsung terlihat.
🔔 Peringatan & notifikasi dapat diaktifkan sehingga Anda menerima:
- peringatan popup (dan suara opsional)
- peringatan saat bar ditutup (disarankan untuk menghindari pemicu palsu saat candle sedang terbentuk)
💬 Bergabunglah dengan kami (optimasi + preset + alat)
Ingin performa terbaik dari indikator ini? Bergabunglah dengan Discord kami untuk:
✅ optimasi parameter untuk simbol broker Anda
✅ preset siap pakai (Crypto / Indeks / FX)
✅ panduan pengaturan multi-timeframe
✅ alat canggih dan pembaruan yang meningkatkan penyaringan sinyal dan kualitas eksekusi
Ringkasan
Ulasan pelanggan
5 | 100 % | |
4 | 0 % | |
3 | 0 % | |
2 | 0 % | |
1 | 0 % |


