
Linear Regression Pro
インジケーター
2 購入済
バージョン 2.0、Jan 2026
Windows、Mac
5.0
レビュー: 1
説明
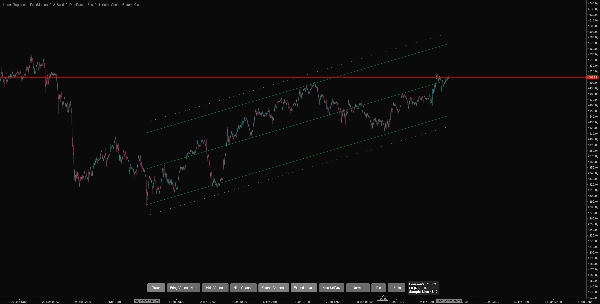
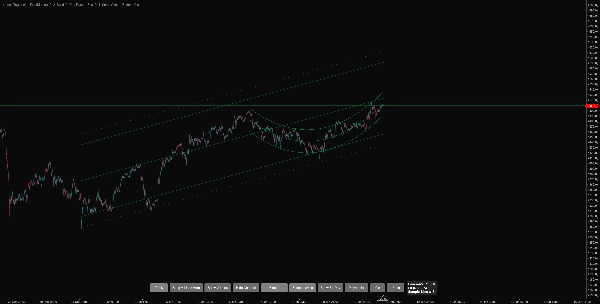
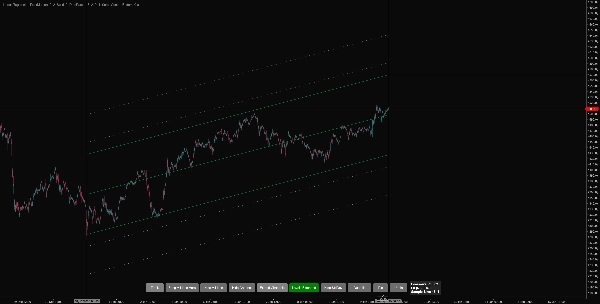
これは、トレンドの特定とボラティリティ分析において精度を求めるトレーダー向けに設計された高度な線形回帰ツールです。単純な平均に依存する標準的な指標とは異なり、このツールは高度な統計アルゴリズムを使用して市場の「真のトレンド」を可視化し、ノイズを除去し、高確率の反転ゾーンを特定します。
ミーンリバージョンスキャルパーであれ、トレンドフォローのスイングトレーダーであれ、このインジケーターは7つの異なる統計エンジンと完全にインタラクティブなインターフェースであなたの戦略に適応します。
これは文字通り最高の線形回帰インジケーターです。どのプラットフォームを使っても、これ以上のものは見つかりません。
主な特徴
1. スマートメモリ&持続性
分析を二度と失わない。
- 自動保存: インジケーターはアクティブなチャネルの正確な位置、好みの設定、そしてすべての「ピン留め」された過去のチャネルを自動的に記憶します。
- セッション継続性: cTraderを閉じたり、時間軸を切り替えたり、シンボルを変更しても、戻ってきたときに分析はまさにそのままの場所にあります。
2. 優れたチャート上コントロール、内蔵の利便性
設定ウィンドウを探し回るのはやめましょう。専用のコントロールパネルでチャートから直接インジケーターを管理できます:
- トラックモード: チャネルを最新の価格アクションに即座にスナップし、新しいバーごとに自動更新します。
- ピン留め&解除: 完璧な過去のトレンドを見つけましたか?「ピン」をクリックしてチャートに永久に固定します。間違えたか間違ったエリアをピン留めしましたか?「アンピン」ボタンで最後にピン留めしたチャネルを即座に削除し、チャートをきれいに保ちます。
- Vラインをここに移動: 現在の表示の中央に垂直セレクターラインを即座に移動し、画面外に消えた場合やスクロールしすぎた場合に回収します。
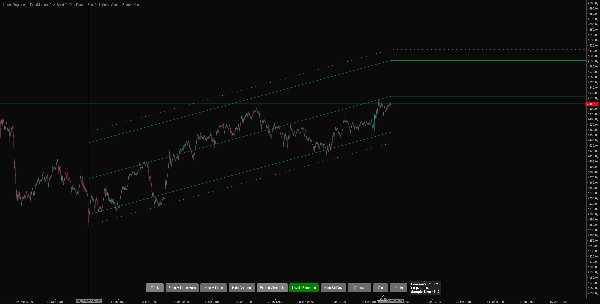
- チャネルの延長: 現在のチャネルを前方に投影します。
- レベルの延長: 最新の価格レベルを水平に前方に投影します。
- 自動着色: トレンド方向を自動検出し、上昇チャネルと下降チャネルにカスタムカラーを適用します。
3. リアルタイム統計スコアリング
トレンドが有効かどうかをただ推測するのではなく、科学的に測定しましょう。
- 適合メーター: インジケーターはパネル上にリアルタイムの統計スコアを表示します。
-
- ピアソンのR(相関係数)、トレンドの整然さを正確に示します(例:-0.95は完璧な下降トレンド)。
- 適合R²(決定係数)、チャネルの信頼性を示します。
- プロのヒント: このスコアを使ってトレードをフィルタリングしましょう。「適合」が0.70未満なら市場はレンジ相場、0.90または0.80以上なら強いトレンドです。
4. 多次元価格分析
ほとんどのインジケーターは「終値」のみを見ますが、このツールは価格データを解釈する5つの異なる方法を提供し、市場のボラティリティを完全に捉えます:
- 高密度: 始値、高値、安値、終値を4つの別々のデータポイントとして扱う独自モード。これにより「ヒゲ」のボラティリティを尊重したチャネルが作成され、安全なエントリーとエグジットポイントを提供します。
- 中央値/典型値/平均: キャンドルのノイズを平滑化し、より明確なシグナルを提供します。
回帰エンジンの説明
このインジケーターには、市場の特定の状況に合わせて設計された8つの異なる数学モデルが含まれています:
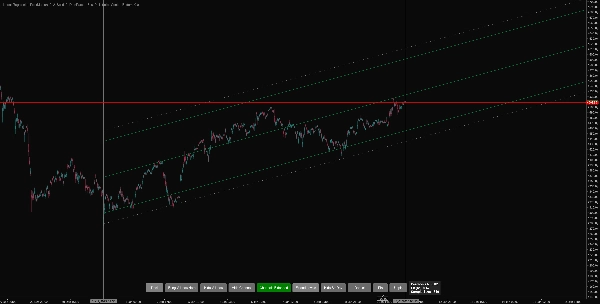
- ノーマル(OLS): 標準の「最適適合」線。健全な市場での一般的なトレンド方向やミーンリバージョン戦略に最適です。
- ラフチャネル: ギルバート・ラフの研究に基づくもの。標準偏差の代わりに価格が線から最大距離を使い、すべての価格アクションを含むチャネルを作成します。トレンドの絶対範囲を決定するのに優れています。
- ロバスト回帰: 外れ値に強い。極端なスパイクや「ヒゲ」を無視して価格アクションのコア部分を通る線を描きます。ニュースイベントのフィルタリングに最適です。
- 加重回帰: 最近の価格により重要性を与えます。標準回帰よりもトレンド変化に速く反応するチャネルを作成します。
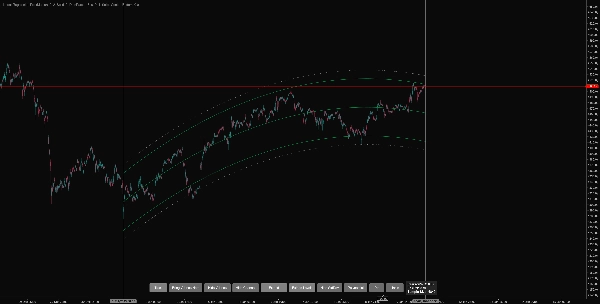
- 多項式: 非線形の曲線回帰。直線では捉えられない複雑な市場構造に適合する柔軟なモデルです。
- シール・セン推定量: すべての可能な点のペアの「中央値の傾き」を見つけるノンパラメトリック手法。市場のノイズやクラッシュイベントに非常に強く、「真の」構造的トレンドを明らかにすることが多いです。
- 分位点回帰: 「平均」(平均値)ではなく「中央値」(50パーセンタイル)に適合させます。価格アクションを完全に半分に分割するチャネルを描き、公正価値分析のための非常に正確な中心線を提供します。
- RANSAC(ランダムサンプルコンセンサス): ランダムなデータのサブセットからモデルを構築する反復手法。ノイズを積極的に除去して支配的なトレンドを見つけ、混沌としたまたは乱高下する価格アクションの中に隠れた明確な市場構造を特定するのに優れています。
概要
インジケーターのプロフィール
カスタマーレビュー
5.0
レビュー: 1
5 | 100 % | |
4 | 0 % | |
3 | 0 % | |
2 | 0 % | |
1 | 0 % |
カスタマーレビュー
January 28, 2026
Linear Regression Pro offers deep trend analysis with regression channels and deviation bands. Best suited for H1 and higher timeframes, where structure and slope are clearly visible. On lower TFs the chart can feel overloaded. A powerful tool for trend-focused traders.
ディスカッション
よくあるご質問
Forex
Signal
cTrader Storeで入手可能な取引ボット、インジケーター、プラグインなどの商品は、第三者の開発者が提供するものであり、情報と技術の取得のみを目的としてご利用いただけます。cTrader Storeはブローカーではなく、投資助言や個人的な推奨を行うことも、将来のパフォーマンスを保証することもありません。


これも好きかも


価格
237.62M
取引数量
1.83M
獲得pips
2
販売
4.64K
無料インストール