
الوصف
🚀 بروفايل الحجم برو لـ cTrader
افتح الهيكل الحقيقي وراء حركة السعر مع بروفايل الحجم برو، مؤشر حجم حسب السعر قوي وقابل للتخصيص بالكامل مصمم خصيصًا للمتداولين المحترفين على cTrader.
تقوم هذه الأداة المتقدمة بتصور بروفايلات حجم فردية لكل فترة زمنية مختارة، مما يتيح لك رؤية بالضبط مكان تركيز النشاط المؤسسي — مباشرة داخل الرسم البياني الخاص بك.
🔎 ما الذي يفعله
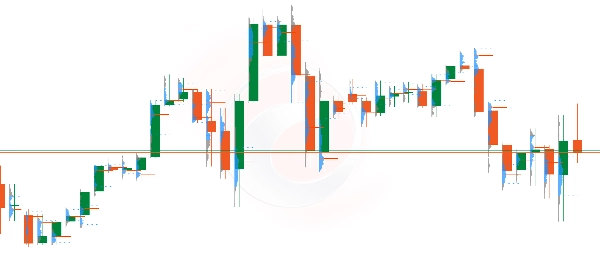
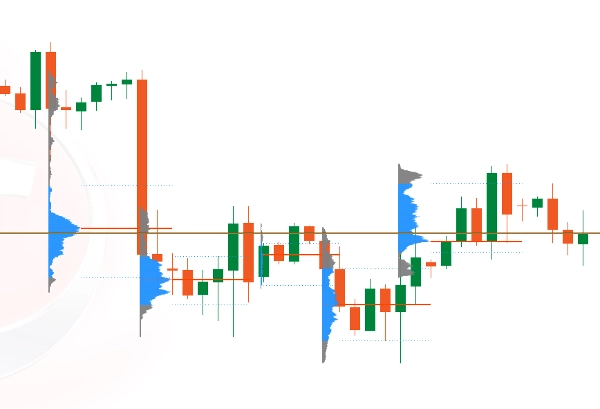
يقوم بروفايل الحجم برو بحساب وعرض توزيع الحجم ضمن نطاق ثابت لكل فترة مكتملة (ساعة، 15 دقيقة، يوم، إلخ)، مرسوم مباشرة على محور السعر لتحليل هيكلي دقيق.
كل بروفايل:
- يرسم بشكل فردي لكل فترة
- يستخدم نطاق سعر ثابت ومتسق
- يعرض توزيع الحجم لكل مستوى سعري
- يسلط الضوء على المستويات المؤسسية الرئيسية
يتم وضع البروفايلات بشكل نظيف إلى يسار كل شمعة، مما يضمن وضوح التعرف على الهيكل دون عرقلة حركة السعر.
⚡ الميزات الرئيسية
✔ بروفايلات حجم فردية لكل فترة زمنية
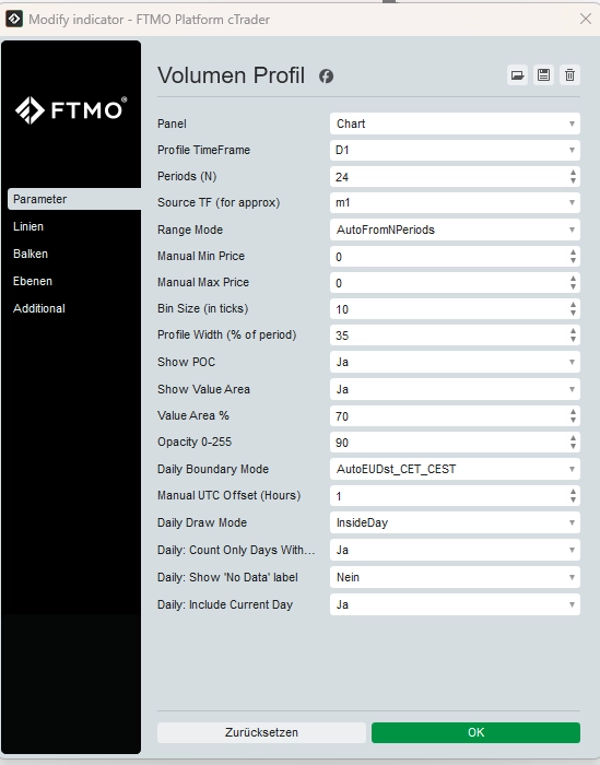
✔ اختيار فترة البروفايل (15 دقيقة، ساعة، 4 ساعات، يوم، إلخ)
✔ نطاق سعر ثابت (تلقائي أو يدوي)
✔ تمييز نقطة التحكم (POC)
✔ أعلى منطقة قيمة (VAH) وأدنى منطقة قيمة (VAL)
✔ عرض سلس بدون وميض في الرسم البياني
✔ محسن بالكامل للأداء
✔ مصمم لبيئات CFD وحجم التيك
📊 لماذا يستخدمه المتداولون
- تحديد مناطق تراكم وتوزيع المؤسسات
- رصد مستويات رد فعل عالية الاحتمالية
- تأكيد قوة الاختراق
- تحسين نقاط الدخول داخل نطاقات التماسك
- مواءمة هيكل الحجم مع حركة السعر
سواء كنت متداول سكالبينج، تداول يومي، أو تداول سوينغ، يمنحك بروفايل الحجم برو ميزة هيكلية.
⚠ إخلاء مسؤولية مهم
بروفايل الحجم هو أداة برمجية للتداول و لا يشكل نصيحة مالية أو استثمارية.
ينطوي تداول الفوركس، والعقود مقابل الفروقات، والأدوات المالية الأخرى على مخاطر كبيرة وقد يؤدي إلى خسارة رأس المال.
🎯 مصمم للدقة. مصمم للمحترفين.
ارتق بتحليل هيكل السوق الخاص بك إلى المستوى التالي وتداول بوضوح وثقة وتحكم.
الملخص
تقييمات العملاء
5 | 100 % | |
4 | 0 % | |
3 | 0 % | |
2 | 0 % | |
1 | 0 % |