
FFT_SDE_Visual Engine
インジケーター
バージョン 1.0、Mar 2026
Windows、Mac
4.6
レビュー: 3
説明
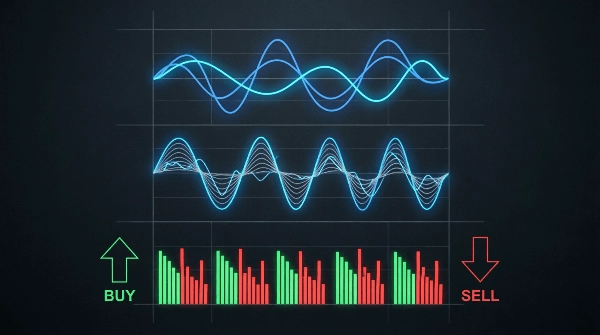
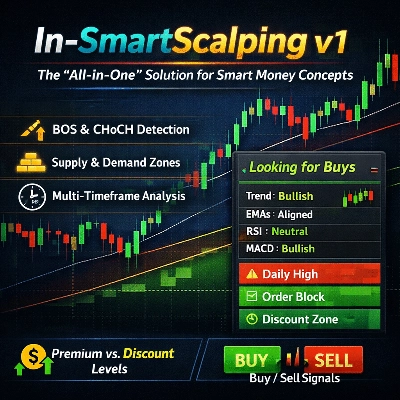
ほとんどのトレーダーは、価格の動きが起こった後に反応する遅行指標に依存しています。 FFT-SDE Visual Engineは根本的に異なる定量的アプローチを採用しています。単なるオシレーターではなく、cTraderに直接組み込まれたリアルタイムの信号処理および予測スイートです。
それは2つの核心原則に基づいて動作します:
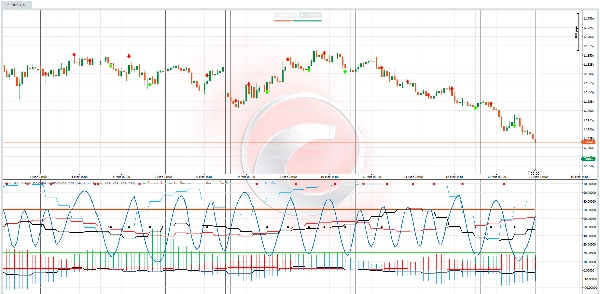
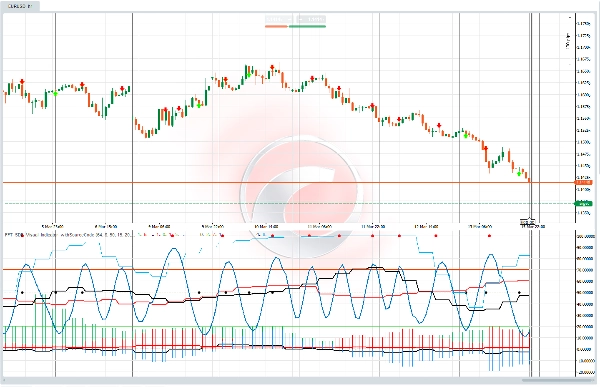
- 市場にはリズム(サイクル)がある:高速フーリエ変換(FFT)分析を使用して、インジケーターは価格の動きを主要な周波数成分に分解し、ノイズを除去して支配的で取引可能なサイクルを明らかにします。これにより、市場が反転しそうな時期を知ることができます。
- 価格の動きには統計的性質がある(SDE):価格を確率微分方程式(オーンシュタイン・ウーレンベック過程)としてモデル化することで、市場のドリフト(モメンタム)、ボラティリティ(リスク)、および平均回帰速度を定量化します。これにより、市場がどのように動くか、そして成功する取引の確率を知ることができます。
これら二つの世界—サイクル分析(FFT)と 確率的予測(SDE)—を融合させることで、FFT-SDEエンジンは標準的なツールでは得られない市場の全体像を提供します。
2. コアユーティリティ:どんな問題を解決するのか?
トレーダーがこのインジケーターを使って意思決定を改善する方法は次の通りです:
- 問題1:「市場がトレンドなのかレンジなのか分からない。」
-
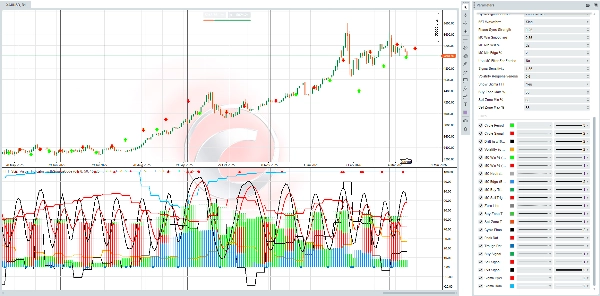
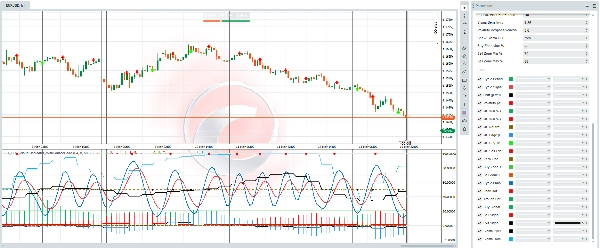
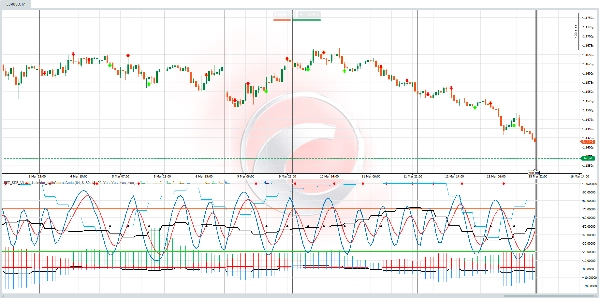
- 解決策(サイクル期間&シグマ循環性): サイクル期間のヒストグラムは現在の支配的な市場サイクルの長さを即座に示します。サイクルが明確で強い場合はスイングトレードが可能です。 シグマ循環性%(ボラティリティサイクル)が高い場合は、リスクの拡大と収縮の期間が予想され、ポジションサイズを動的に調整できます。
- 問題2:「エントリーがいつも早すぎるか遅すぎる。」
-
- 解決策(サイクルフェーズ&エントリーゾーン):インジケーターは市場のサイクルを滑らかな0-100%の波にマッピングします—サイクルフェーズ%。トップやボトムを推測する代わりに、価格が事前定義された買い(0-35%)および売り(60-88%)ゾーンに入るのを待つことができます。これらは任意のレベルではなく、市場の支配的な周波数から動的に導出されており、重要なタイミングの優位性をもたらします。
- 問題3:「セットアップが成功する確率が高いか分からない。」
-
- 解決策(モンテカルロシミュレーション):これはキラー機能です。各バーごとに、エンジンは現在の市場動態に基づいて数百のシミュレートされた価格パス(モンテカルロ)を実行します。次に、MC勝率%(買い)およびMC勝率%(売り)を出力します。これは感覚や直感ではなく、1:2.5のリスクリワード取引がエントリー前に成功する統計的確率です。文字通り勝率が自分に有利かどうかを見ることができます。
- 問題4:「標準的な指標は遅くてノイズが多すぎる。」
-
- 解決策(適応的かつ多面的):このインジケーターは静的ではありません。 適応型ボラティリティモデルは価格ショックやサイクルのインパルスにリアルタイムで反応します。 シグマFFTはボラティリティ自体が循環的になっているかを知らせ、静かな期間や爆発的な期間の到来を警告します。すべてのコンポーネントは現在の市場状況に適応するよう設計されています。
cTraderマーケットプレイスでこれらの機能を単一の一貫した視覚的システムに組み合わせた他のインジケーターは見つかりません。
- 「シグマFFT」レイヤー:価格にサイクルがあることを知るのは一つのことですが、 ボラティリティ自体にサイクルがあることを知るのは全く新しいレベルの洗練です。これにより、市場構造の変化を予測する大きな優位性が得られます。
- 確実性ではなく確率的優位性:モンテカルロの出力はトレーダーを「聖杯」的な確実性の追求から遠ざけ、確率と優位性を管理するプロのマインドセットへと導きます。
- 完全に視覚的かつカスタマイズ可能:この複雑な数学はすべて、クリーンでマルチパネルのフォーマットで提示され、27以上のパラメーターで広範なカスタマイズが可能です。スキャルピングからスイングトレードまで、特定の取引スタイルに合わせて調整できます。
- 一貫した融合:買い/売りシグナルを生成するサイクルフェーズは、ドリフトと適応型ボラティリティを計算するために使用される同じサイクルです。インジケーターのすべての部分が互いに連携し、統一された一貫性のある市場モデルを作り出しています。
このインジケーターは以下のトレーダーに最適です:
- 遅行指標に疲れ、より予測的で科学的なアプローチを求めている人。
- サイクル、ボラティリティ、統計的確率の価値についてある程度理解している人。
- 堅牢でルールベースの取引システムを構築したい人。
- サイクル的な動きをする金融商品(例:FXペア、指数、金などのコモディティ)を取引している人。
- 市場で真の優位性を得るためにプロフェッショナルグレードのツールに投資する意欲がある人。
FFT-SDE Visual Engineは複雑な定量ファイナンスの概念を実用的で行動可能な取引ツールに変換します。推測から確信へ、反応から予測へとあなたを導きます。市場構造の深い理解と定量化可能な確率的優位性を持って取引する準備ができているなら、これがあなたが待ち望んでいたエンジンです。
概要
インジケーターのプロフィール
インジケーターのカテゴリー
トレンド
出力の種類
ビジュアル表示
シグナル
フィルター
データ要件
バーのみ
ティックデータ
サポート対象のシグナル
クロス
ダイバージェンス
トレンドの強さ
カスタマーレビュー
4.6
レビュー: 3
5 | 67 % | |
4 | 33 % | |
3 | 0 % | |
2 | 0 % | |
1 | 0 % |
カスタマーレビュー
March 25, 2026
Ngl, this one makes sense if you are not trying to yolo every signal. Keeping it on demo first and see how it behaves when momentum shifts gets messy.
March 22, 2026
This feels useful once the trader already has a plan. The main value is checking stretched conditions, not chasing every signal that appears. The part to watch is whether bad trades cluster too quickly.
March 20, 2026
No need to judge this from 1 good trade. A better check is RSI 30 and 70, 2 swing checks and 25 signals before using a larger account. Better rechecked it on H1 and M15.
ディスカッション
よくあるご質問
BTCUSD
Crypto
cTrader Storeで入手可能な取引ボット、インジケーター、プラグインなどの商品は、第三者の開発者が提供するものであり、情報と技術の取得のみを目的としてご利用いただけます。cTrader Storeはブローカーではなく、投資助言や個人的な推奨を行うことも、将来のパフォーマンスを保証することもありません。
この作成者の他の商品


価格
49
販売
306
無料インストール