
説明
TwoSMAプレミアム:究極のトレンドフォローシステム
人気のTwoSMAインジケーターのプレミアムバージョンで手動取引を次のレベルへ引き上げましょう。クラシックな移動平均クロスオーバーストラテジーをプロフェッショナルなオールインワントレーディングダッシュボードに変換しました。
どの市場データを分析しますか? このインジケーターは、終値に基づく高速単純移動平均(デフォルト:5)と低速単純移動平均(デフォルト:34)のクロスオーバーを追跡します。デフォルトでは、市場のノイズを除去し主要なトレンドを捉えるよう高度に最適化されています。
シグナルとビジュアルの解釈方法:
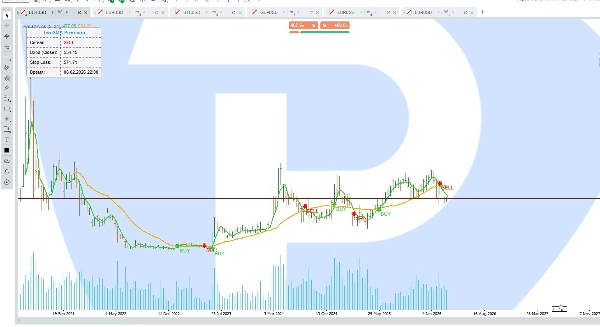
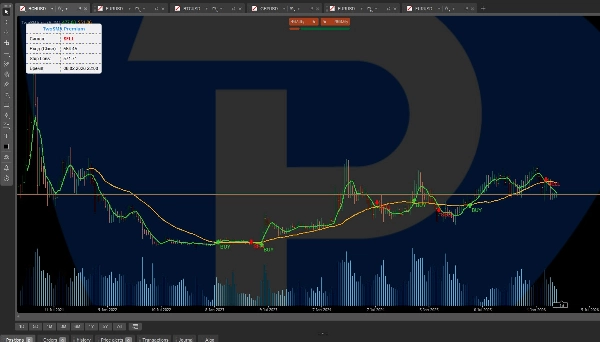
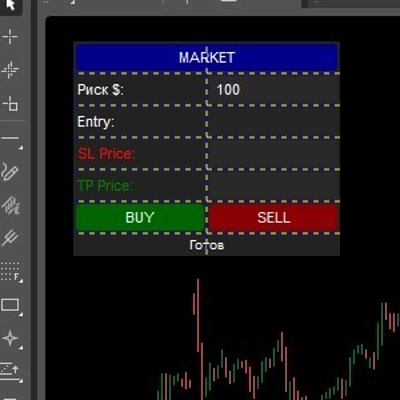
- インタラクティブUIダッシュボード: チャート上の洗練された控えめなパネルに最新のアクティブシグナル、正確なエントリー価格、計算されたストップロス、シグナルの時間が表示されます。チャートのライトまたはダークテーマに自動で適応します。
- チャート上のビジュアル: もう推測は不要です。正確なクロスオーバーポイントがローソク足上に直接、明確な上昇(緑)と下降(赤)の矢印と正確なエントリー価格ラベルで示されます。
- スマートストップロス: インジケーターはシグナルローソク足の極値(高値/安値)に基づいて論理的なストップロスレベルを自動計算し、適切なリスク管理を支援します。
主要設定:
- 高速MA期間: 完全にカスタマイズ可能(デフォルト:5)
- 低速MA期間: 完全にカスタマイズ可能(デフォルト:34)
典型的な使用例と取引シナリオ: 任意の時間枠に適用可能ですが、このインジケーターは週足および日足チャートで長期トレンドを捉えるのに特に優れています。金(XAUUSD)や主要なFXペアのようなボラティリティの高い資産に非常に有用です。正確なストップロスレベルを提供するため、厳格なリスク管理に欠かせないツールであり、FTMOのようなプロップファームチャレンジに挑戦するトレーダーに最適です。
対象者は? このツールは、スイングトレーダー、ポジショントレーダー、そして取引前に明確な視覚的確認と厳格なリスクパラメータを必要とするあらゆる経験レベルのプロップファームチャレンジャー向けに設計されています。
重要な注意事項: これは自動取引ロボット(cBot)ではなく、手動取引用の視覚的かつ分析的なインジケーターです。シグナルとデータを提供しますが、実際の取引はご自身で行ってください。
概要
AIによる概要
TwoSMA is a trend-following indicator designed for manual trading, featuring an interactive dashboard and precise BUY/SELL signals based on the crossover of two Simple Moving Averages (default periods: 5 and 34) calculated from closing prices. It filters market noise to identify major trends, particularly effective on Weekly and Daily charts. The indicator visually marks exact crossover points on the price chart with green (UP) and red (DOWN) arrows, accompanied by entry price labels. A smart Stop-Loss level is automatically calculated using the high or low of the signal candle to assist with risk management. The user interface adapts to light or dark chart themes and displays the latest active signal, entry price, Stop-Loss, and signal time. TwoSMA is suitable for Swing and Position Traders, as well as traders undertaking Prop Firm challenges, especially on volatile assets like Gold (XAUUSD) and major Forex pairs. It offers full customization of the Fast and Slow moving average periods. This tool provides visual and analytical support but does not execute trades automatically; users must manually act on the signals.
インジケーターのプロフィール
カスタマーレビュー
4.0
レビュー: 1
5 | 0 % | |
4 | 100 % | |
3 | 0 % | |
2 | 0 % | |
1 | 0 % |
カスタマーレビュー
March 24, 2026
It works as a side layer because the journal looks less noisy. It can look better than it is during a lucky run.
ディスカッション
よくあるご質問
Indices
Crypto
Stocks
cTrader Storeで入手可能な取引ボット、インジケーター、プラグインなどの商品は、第三者の開発者が提供するものであり、情報と技術の取得のみを目的としてご利用いただけます。cTrader Storeはブローカーではなく、投資助言や個人的な推奨を行うことも、将来のパフォーマンスを保証することもありません。


価格
登録日 11/01/2025
4
販売
439
無料インストール