
Descrizione
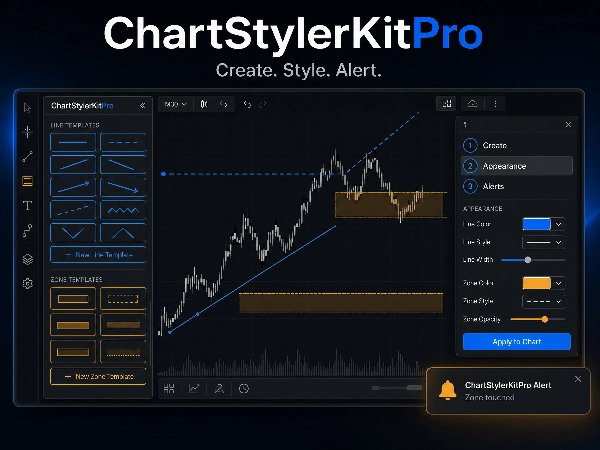
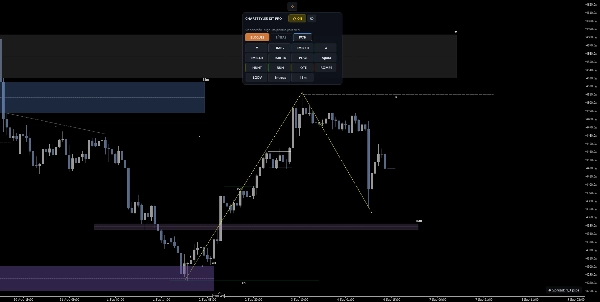
ChartStyleKitPro è un indicatore cTrader progettato come un pannello di controllo centralizzato per la gestione, lo stile e l'organizzazione degli oggetti grafici (rettangoli e linee di tendenza). Il suo scopo è eliminare il compito manuale e ripetitivo di stilizzare individualmente ogni disegno sul grafico, offrendo azioni di massa, modelli riutilizzabili e testo automatico intelligente.
L'indicatore funziona come una sovrapposizione: non genera segnali né calcola indicatori tecnici. Il suo valore risiede nella produttività e nella coerenza visiva dell'analisi del grafico.
Caratteristiche principali
1. Pannello di controllo interattivo
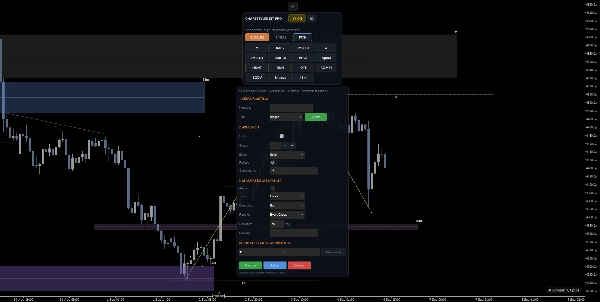
Crea un modello nominato
Apri l'icona dell'ingranaggio e individua 1. CREA MODELLO. In questa sezione, digita il nome iniziale del modello, seleziona Blocco o Linea e clicca Crea. Il modello riceve quindi il suo nome da questo primo passaggio.
Un nuovo modello inizia con valori sicuri e modificabili: colore base, spessore, stile solido, riempimento secondo il tipo e avvisi disabilitati. La creazione non disegna automaticamente un oggetto; prima registra il modello affinché possa essere revisionato e utilizzato dalla griglia.
2. Configura l'aspetto
Seleziona le proprietà visive che desideri riutilizzare. Clicca Salva per mantenere le modifiche.
3. Linea automatica al 50%
Per ogni rettangolo disegnato, l'indicatore calcola e disegna automaticamente una linea orizzontale nel punto medio (50%) tra il prezzo superiore e inferiore del rettangolo.
- La linea è tratteggiata per impostazione predefinita (configurabile)
- Include un'etichetta "50%" sul bordo sinistro
- Si aggiorna in tempo reale se sposti o ridimensioni il rettangolo
- Si nasconde/mostra insieme al rettangolo padre (comportandosi come un unico oggetto)
Uso tipico: zone di equilibrio all'interno di un intervallo di prezzo, livelli decisionali all'interno di zone di offerta/domanda.
3. Automatic 50% line
For each rectangle drawn, the indicator automatically calculates and draws a horizontal line at the midpoint (50%) between the upper and lower price of the rectangle.
- The line is dotted by default (configurable)
- Includes a "50%" label on the left edge
- Updates in real time if you move or resize the rectangle
- Hides/shows together with the parent rectangle (behaving as a single object)
- Typical use: equilibrium zones within a price range, decision levels within supply/demand zones.
4. Testo automatico nei rettangoli
Se un rettangolo ha un Commento, l'indicatore lo rende come testo visibile all'interno del rettangolo.
- Posizione calcolata automaticamente: angolo in alto a destra con margini configurabili
- Margine verticale in pips (dal bordo superiore)
- Margine orizzontale in ore (dal bordo destro)
- Dimensione del font adattabile alla dimensione della finestra
- Colore, grassetto e font configurabili
- Uso tipico: etichette come "Zona di Offerta", "Zona di Acquisto", "FVG", "Blocco Ordini" visualizzate direttamente sulla zona senza necessità di testo manuale aggiuntivo.
5. Modelli di stile
Sistema CRUD completo (Crea, Leggi, Aggiorna, Elimina) per salvare e riutilizzare configurazioni visive degli oggetti.
Cosa salva ogni modello:
- Colore
- Spessore
- Stile della linea (solido, tratteggiato, ecc.)
- Riempimento (per i rettangoli)
- Stato di visibilità
- Stato di blocco
- Commento
Operazioni disponibili:
Descrizione Azione
Salva
Estrae lo stile dall'oggetto selezionato e lo salva con un nome personalizzato. Include campo commento opzionale.
Applica
Carica un modello salvato e lo applica a tutti gli oggetti selezionati.
Aggiorna
Sovrascrive un modello esistente con lo stile corrente dell'oggetto selezionato.
Rinomina
Modifica il nome di un modello esistente.
Elimina
Rimuove un modello dall'archivio.
Toni caldi, meno affaticamento visivo durante sessioni lunghe
Il colore di accento è configurabile (blu predefinito #4DA6FF). I pulsanti di attivazione calcolano automaticamente i colori attivi/inattivi con contrasto garantito.
Riepilogo
Key features include:
- Interactive control panel: When selecting graphical objects, a floating panel appears showing the count and type of selected items, with buttons to lock/unlock, hide/show, toggle fill for rectangles, hide/show all objects, and manage style templates. Contextual help guides available actions.
- Automatic 50% line: For each rectangle, the indicator draws a horizontal line at the midpoint between its top and bottom prices, updating in real time with movement or resizing. This line includes a "50%" label and hides/shows with its parent rectangle.
- Automatic text rendering: Comments attached to rectangles or trend lines are displayed as text within or above the objects, with configurable position, margins, font size, and style.
- Style templates: A full CRUD system allows saving, applying, updating, renaming, and deleting visual style templates that store color, thickness, line style, fill, visibility, lock state, and comments for objects.
- Four interface color themes: Dark, Light, Midnight, and Warm, each with configurable accent colors and automatic toggle button contrast.
This tool supports efficient management of chart annotations commonly used in market structure and Smart Money Concepts analysis, including supply/demand zones, order blocks, fair value gaps, and support/resistance levels.
Recensioni dei clienti
Discussioni
Domande frequenti

![Logo di "Wyckoff Toolkit [Iridio Capital]"](https://cdn.ctrader.com/image/webp/5318c788-91ef-4297-bca6-4ce73b1516a8_61556)









![Logo di "[Hamster-Coder] Pivot Points MTF"](https://cdn.ctrader.com/image/webp/4c143e5a-309c-40e3-a578-f04d1e133ffa_31159)






Prezzo
