Mô tả
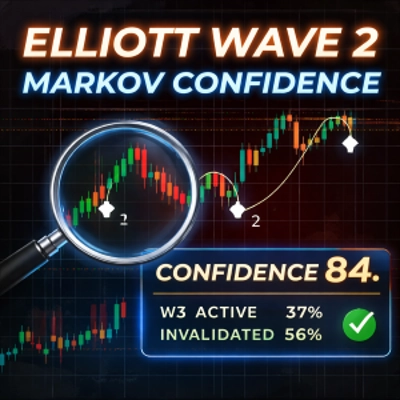
Elliott CLEAN — Wave2 + Độ tin cậy Markov
Elliott CLEAN là một chỉ báo phân tích nâng cao được thiết kế để giúp các nhà giao dịch xác định, xác thực và quản lý các thiết lập Elliott Wave 2 sử dụng sự kết hợp của cấu trúc thị trường và xác suất thống kê.
Thay vì dự đoán hướng giá, chỉ báo tập trung vào các chuyển đổi cấu trúc và trả lời một câu hỏi hữu ích hơn:
Khả năng một Wave 2 phát triển thành Wave 3 hợp lệ và bền vững là bao nhiêu — và nhà giao dịch nên có bao nhiêu độ tin cậy vào kịch bản đó?
Chức năng của Chỉ báo này
Elliott CLEAN tự động:
- Phát hiện cấu trúc Wave 1–Wave 2 dựa trên các điểm xoay swing
- Xác định điểm kích hoạt, dừng lỗ, vô hiệu hóa và mục tiêu Wave 3
- Theo dõi kết quả cấu trúc lịch sử sử dụng mô hình Markov 5 trạng thái
- Tính toán xác suất có điều kiện cho:
-
- Kích hoạt Wave 3
- Vô hiệu hóa thiết lập
- Sự kiệt sức sớm của Wave 3
- Chuyển đổi các xác suất này thành một Điểm Độ Tin Cậy duy nhất (0–100)
Điều này cho phép các nhà giao dịch lọc các thiết lập chất lượng thấp, tránh giao dịch quá mức và chỉ thực hiện giao dịch khi cấu trúc và thống kê phù hợp.
Các Tính năng Chính
- ✅ Phát hiện tự động Elliott Wave 2
- ✅ Nhiều chế độ xác nhận (Break+Hold, Break, Reclaim, Wick)
- ✅ Điểm kích hoạt, dừng lỗ, vô hiệu hóa và mục tiêu rõ ràng
- ✅ Bộ máy xác suất Markov 5 trạng thái (dựa trên sự kiện/swing, không dựa trên thanh)
- ✅ Xác suất có điều kiện thời gian thực hiển thị trên biểu đồ
- ✅ Điểm Độ Tin Cậy duy nhất (0–100) hỗ trợ quyết định
- ✅ Thiết kế HUD sạch sẽ, không gây phiền nhiễu
- ✅ Hoạt động trên bất kỳ ký hiệu và khung thời gian nào
Điểm Độ Tin Cậy (Quan trọng)
Điểm Độ Tin Cậy không phải là tỷ lệ thắng và không phải là tín hiệu.
Nó là một chỉ số chất lượng theo ngữ cảnh được rút ra từ các chuyển đổi cấu trúc lịch sử:
- Trong Wave 2, điểm phản ánh:
-
- Xác suất Wave 3 bắt đầu
- Điều chỉnh theo xác suất thất bại sớm
- Trong Wave 3, điểm phản ánh:
-
- Khả năng lịch sử Wave 3 tiếp tục mà không bị kiệt sức sớm
Trong thực tế:
- Điểm thấp = cấu trúc yếu hoặc không đáng tin cậy
- Điểm cao = cấu trúc hiếm nhưng vững chắc về mặt thống kê
Điều này giúp các nhà giao dịch quyết định khi nào nên thận trọng và khi nào nên để giao dịch phát huy.
Các Trường hợp Sử dụng Điển hình
- ✔ Lọc các thiết lập Elliott Wave trước khi vào lệnh
- ✔ Tránh các giao dịch Wave 2 biên hoặc chất lượng thấp
- ✔ Điều chỉnh kích thước vị thế dựa trên độ tin cậy
- ✔ Quản lý các giao dịch Wave 3 với ít can thiệp cảm xúc hơn
- ✔ Hỗ trợ giao dịch tùy ý với dữ liệu cấu trúc khách quan
Chỉ báo đặc biệt hữu ích cho các nhà giao dịch đã hiểu lý thuyết Elliott Wave và muốn xác nhận định lượng mà không cần tự động hóa.
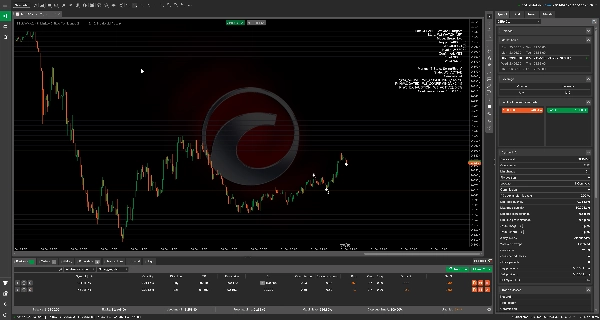
Cách Sử dụng (Quy trình cơ bản)
- Gắn chỉ báo vào biểu đồ
- Chọn chế độ xác nhận ưa thích của bạn
- Chờ cấu trúc Wave 2 hợp lệ
- Quan sát:
-
- Điểm kích hoạt, dừng lỗ, vô hiệu hóa
- Xác suất Markov
- Điểm Độ Tin Cậy
- Quyết định xem thiết lập có đáng giao dịch dựa trên cấu trúc + độ tin cậy
Lưu ý Quan trọng & Tuyên bố từ chối trách nhiệm
- Chỉ báo này là phân tích, không phải dự đoán
- Nó không tạo ra tín hiệu mua/bán
- Thống kê cấu trúc quá khứ không đảm bảo kết quả tương lai
- Giao dịch có rủi ro; người dùng hoàn toàn chịu trách nhiệm về quyết định của mình
Chỉ báo được thiết kế như một công cụ hỗ trợ quyết định cho các nhà giao dịch tùy ý.
Ai là người phù hợp với Chỉ báo này
- Các nhà giao dịch quen thuộc với khái niệm Elliott Wave
- Các nhà giao dịch tùy ý coi trọng cấu trúc hơn chỉ báo
- Các nhà giao dịch tìm kiếm bộ lọc khách quan, không phải hệ thống tự động
- Người dùng muốn bối cảnh xác suất, không phải nhãn hậu kiểm
_______________________
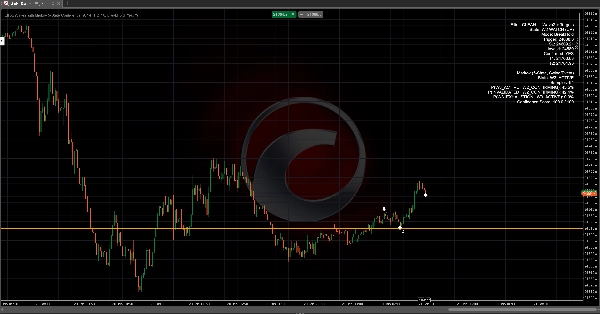
HUD & Các Trạng thái
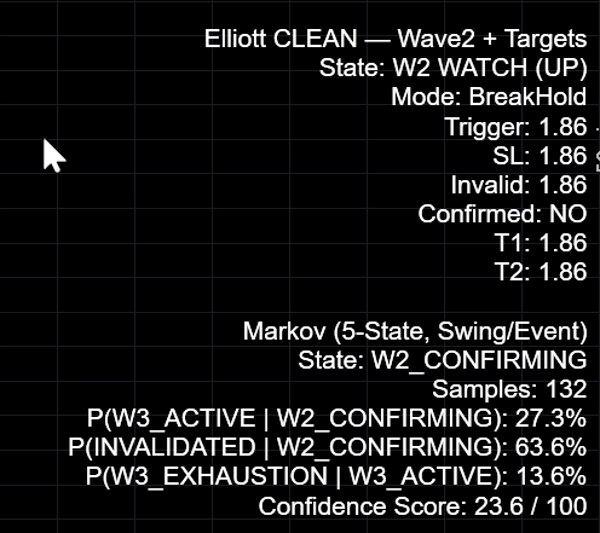
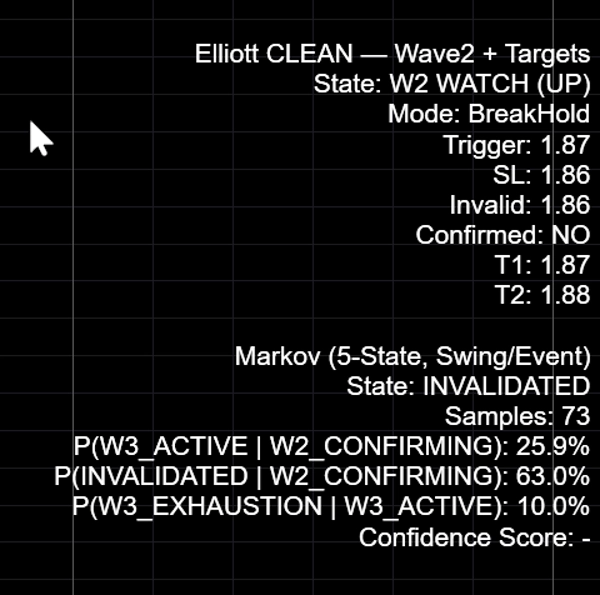
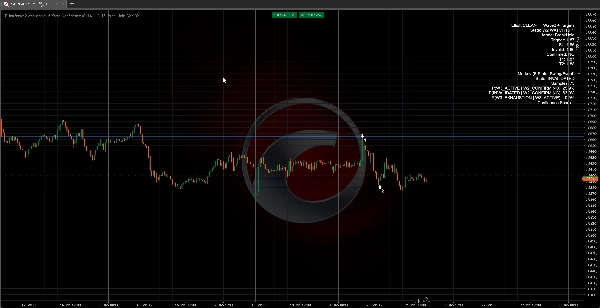
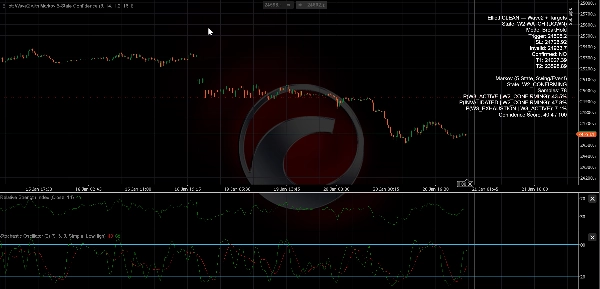
Chỉ báo in các mức cấu trúc và xác suất Markov trực tiếp trên biểu đồ.
Lớp Elliott cốt lõi:
- Trạng thái: W2 WATCH (LÊN/XUỐNG) — có khả năng Wave 2 hiện diện (đã tìm thấy cấu trúc)
- Xác nhận: CÓ/KHÔNG — quy tắc xác nhận bạn chọn đã được kích hoạt
- Kích hoạt — giá mức phải phá vỡ/thu hồi (tùy thuộc vào chế độ)
- SL — mức dừng bảo vệ đề xuất (tùy thuộc vào chế độ SL)
- Vô hiệu — mức vô hiệu cấu trúc (bắt đầu Wave 1)
- T1/T2 — dự báo Wave 3 sử dụng hệ số nhân
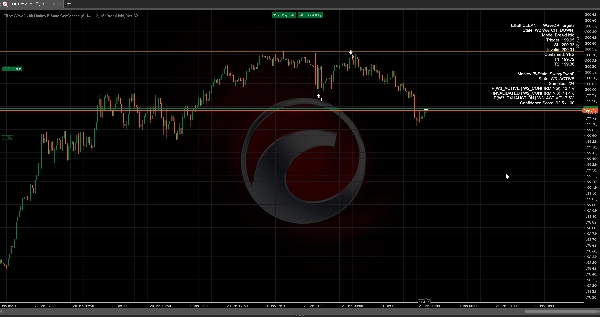
Lớp Markov:
- Trạng thái — trạng thái Markov hiện tại (ví dụ,
W2_CONFIRMING,W3_ACTIVE,INVALIDATED) - Mẫu — số liệu lịch sử dùng cho xác suất
- P(W3_ACTIVE | W2_CONFIRMING) — khả năng Wave 3 kích hoạt từ giai đoạn Wave 2
- P(INVALIDATED | W2_CONFIRMING) — khả năng thiết lập thất bại trong giai đoạn Wave 2
- P(W3_EXHAUSTION | W3_ACTIVE) — khả năng Wave 3 thất bại sớm khi đã kích hoạt
Điểm Độ Tin Cậy (0–100)
Điểm Độ Tin Cậy không phải là tỷ lệ thắng và không phải là sự đảm bảo. Nó là một chỉ số chất lượng được rút ra từ các chuyển đổi cấu trúc lịch sử.
Cách sử dụng điểm:
- Trong
W2_CONFIRMING, điểm phản ánh “khả năng kích hoạt” được điều chỉnh theo rủi ro thất bại sớm. - Trong
W3_ACTIVE, điểm phản ánh “độ bền tiếp tục” (rủi ro kiệt sức sớm thấp).
Luôn diễn giải điểm cùng với: (1) độ rõ ràng của cấu trúc, (2) khoảng cách vô hiệu, và (3) kích thước mẫu.
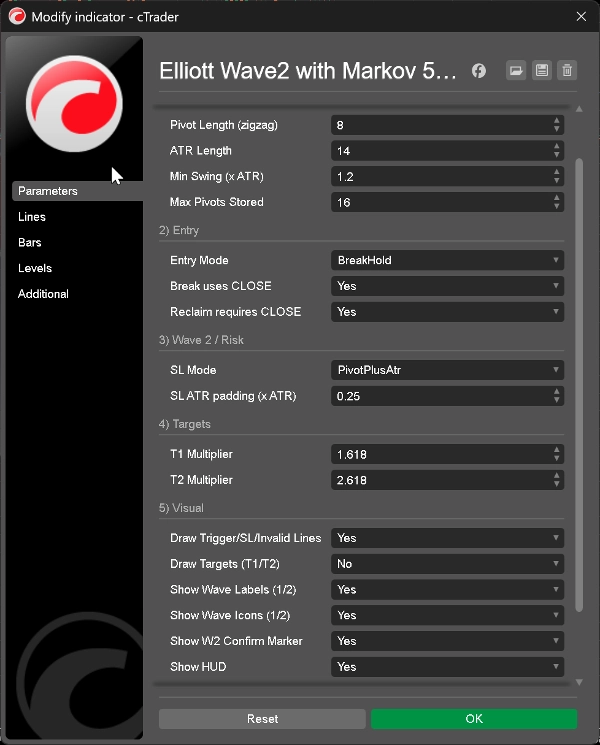
Các đầu vào (Chức năng của chúng)
1) Điểm xoay / Cấu trúc
- Độ dài điểm xoay (zigzag): Kiểm soát độ nhạy swing. Cao hơn = ít swing hơn, cấu trúc sạch hơn.
- Độ dài ATR: Cửa sổ ATR dùng để lọc swing và đệm SL tùy chọn.
- Swing tối thiểu (×ATR): Kích thước swing tối thiểu để chấp nhận điểm xoay (lọc nhiễu).
- Số điểm xoay lưu trữ tối đa: Giới hạn lịch sử swing lưu trữ (hiệu suất & ổn định).
2) Vào lệnh
- Chế độ vào lệnh: Chọn kiểu xác nhận:
-
BreakHold— an toàn hơn: phá vỡ rồi giữ trên điểm kích hoạtBreak— nhanh hơn: phá vỡ điểm kích hoạt một lầnReclaim— hành vi quét + thu hồiWick— quyết liệt: wick xuyên qua điểm kích hoạt
- Break sử dụng CLOSE: Dùng giá đóng cửa thay vì wick cho logic phá vỡ (khuyến nghị).
- Reclaim yêu cầu CLOSE: Yêu cầu đóng cửa ở phía đúng sau khi quét.
3) Wave 2 / Rủi ro
- Chế độ SL: Xác định cơ sở đặt dừng.
- Đệm SL ATR (×ATR): Đệm thêm khi dùng dừng dựa trên ATR.
4) Mục tiêu
5) Hình ảnh
- Vẽ các đường Kích hoạt/SL/Vô hiệu: Hiện/ẩn các mức ngang cốt lõi.
- Vẽ Mục tiêu: Đường mục tiêu tùy chọn (ít “sạch” hơn).
- Hiện Nhãn / Biểu tượng Wave: Hiển thị các dấu hiệu sóng (1/2).
- Hiện dấu xác nhận W2: Hiển thị dấu xác nhận.
- Hiện HUD: Hiện/ẩn toàn bộ HUD.
Cách sử dụng:
- Quét nhiều thị trường, sau đó chỉ tập trung vào các môi trường cấu trúc chất lượng cao hơn.
- Sử dụng điểm + kích thước mẫu để quyết định khi nào thiết lập đáng giá thời gian và rủi ro.
Câu hỏi thường gặp
Chỉ báo này có hoạt động trên tất cả các ký hiệu và khung thời gian không?
Có. Đây là phương pháp dựa trên cấu trúc. Kết quả và xác suất sẽ thay đổi theo hành vi và biến động thị trường.
Điểm Độ Tin Cậy có phải là tỷ lệ thắng không?
Không. Nó là điểm chất lượng cấu trúc được rút ra từ các chuyển đổi trạng thái lịch sử (mô hình Markov). Nó không đảm bảo kết quả.
Tại sao điểm thường thấp trong Wave 2?
Bởi vì kích hoạt Wave 3 là có chọn lọc. Nhiều ứng viên Wave 2 thất bại hoặc dao động. Chỉ báo được thiết kế để lọc những trường hợp đó.
Còn kích thước mẫu nhỏ thì sao?
Xem các xác suất là kém ổn định hơn khi kích thước mẫu nhỏ. Sử dụng điểm như bối cảnh, không phải sự chắc chắn.
Tuyên bố từ chối rủi ro
Giao dịch có rủi ro và có thể không phù hợp với tất cả nhà đầu tư. Hiệu suất quá khứ và xác suất lịch sử không đảm bảo kết quả tương lai. Chỉ báo này cung cấp thông tin phân tích và không cấu thành lời khuyên đầu tư hay khuyến nghị mua hoặc bán bất kỳ công cụ nào. Bạn chịu trách nhiệm về các quyết định, quản lý rủi ro và tuân thủ quy định địa phương.
Elliott Wave, Cấu trúc Thị trường, Phân tích Kỹ thuật, Xác suất, Phân tích Thống kê, Giao dịch Swing, Quản lý Rủi ro, Hỗ trợ Quyết định
Tóm tắt
Đánh giá của khách hàng
5 | 100 % | |
4 | 0 % | |
3 | 0 % | |
2 | 0 % | |
1 | 0 % |


![Logo "[CB] Pivot Points Pro"](https://cdn.ctrader.com/image/webp/43463c82-67b0-4f10-a4ba-901bba091d81_32594)


![Logo "Gaussian Channel [Iridio Capital]"](https://cdn.ctrader.com/image/webp/7c039209-5573-4a54-a072-f9528b503103_41960)