present
新規登録で初回購入時に$50オフ
Trading product for Harmonic インジケーター Support & Resistance, image 1
Harmonic
インジケーター
バージョン 1.0、Aug 2026
Windows、Mac
Trading product for Harmonic インジケーター Support & Resistance, image 2
登録日 22/07/2026

説明

Harmonic Strategy Suite Pro


Most harmonic indicators draw a pattern and leave you guessing whether it is

worth trading. This one answers that question: every pattern it finds is

replayed against the chart's own history, so you see the real hit rate of each

pattern type on the instrument and timeframe in front of you - before you risk

anything.


What it analyses


The indicator works purely from price structure - no indicators layered on

indicators, no repainting of confirmed patterns.


An original pivot engine sweeps the chart across a whole range of swing depths

at once, so it catches structures at several scales instead of only the one

your settings happen to favour. Consecutive same-direction pivots are merged to

the true extreme, giving a clean alternating high-low-high sequence.


Every consecutive five-pivot window (X-A-B-C-D) is then measured against the

published Fibonacci definitions of six classic harmonic patterns:


Gartley B at 0.618 of XA, D at 0.786

Bat B at 0.382-0.50, D at 0.886

Butterfly B at 0.786, D at 1.272-1.618

Crab B at 0.382-0.618, D at 1.618

Shark B at 1.13-1.618, D at 0.886-1.13

Cypher B at 0.382-0.618, C at 1.272-1.414, D at 0.786


A tolerance setting controls how strictly those ratios must be met, and each

detection is scored 0-100 by how close it sits to the ideal ratio - so a

textbook Gartley is visibly distinguished from a loose one.


The backtester - what makes this different


This is the part most harmonic tools do not have.


For every pattern found, the indicator simulates the trade that pattern would

have produced:


- A limit order is placed at the D completion point.

- If price reaches the target or the stop BEFORE touching D, the setup is

treated as invalidated and never becomes a trade - exactly as a real

resting order would be cancelled.

- Unfilled orders time out after 15 bars.

- Filled trades are then followed bar by bar to see whether they reached

Target 1, Target 2, or the stop first.


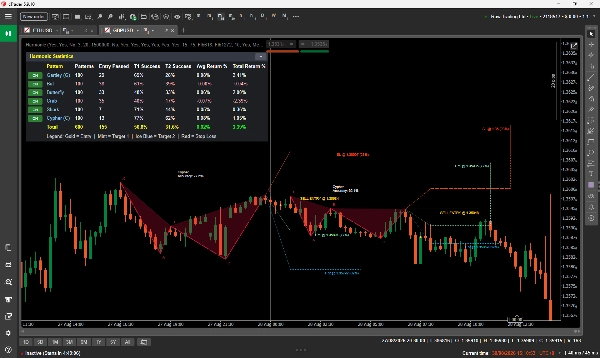
Those results are compiled into an on-chart dashboard showing, per pattern type:


Patterns found | Entries filled | Target 1 hit rate | Target 2 hit rate |

Average return | Total return


with a combined total row. Losing rows are highlighted, and each pattern type

has an ON/OFF button that instantly filters it off the chart. The panel

collapses to a single title bar when you want a clear view.


You can see at a glance that, for example, Cypher fills rarely but converts

often on this pair, while Crab fills more and converts less. That is a

judgement you can act on - and it is measured on your broker's data, not

quoted from a book.


How to read the chart


Each pattern is drawn as its X-A-B-C-D skeleton with shaded triangles. The

shading is not decorative: the more often that pattern type reached Target 1 in

the backtest, the more solid its fill, so reliable structures stand out

immediately.


Every pattern carries its full trade plan:


Gold Entry line, labelled BUY ENTRY / SELL ENTRY with the exact price

Mint Target 1, labelled with the price and that pattern's T1 hit rate

Ice blue Target 2, same treatment

Red Stop loss


Line styling tells you what happened. A level that price actually reached is

drawn SOLID and stops on the bar it was hit. A level that was never reached

stays DOTTED and runs to the end of the setup. A gold dot marks the

confirmation bar. Labels sit at the end of their own line, with a leader drawn

in whenever one has to be nudged to stay readable.


Pattern name and accuracy are printed beside each structure, positioned below

bullish setups and above bearish ones so they never sit on the price action.


Key settings


Include Bullish / Bearish Patterns Trade direction filter

Enable Gartley ... Enable Cypher Turn individual patterns off entirely

Pivot Finder Min / Max Depth Swing sensitivity range (3-20). A

higher minimum finds fewer, larger

structures

Allowed Fib Ratio Error % Ratio tolerance. 15% is a balanced

default; lower it for textbook-only

detections

Stop Loss Distance Stop placement beyond D, as a

percentage of the AD range

Target 1 / Target 2 Ratio Fibonacci multiples of AD

Historical Bars to Scan Depth of the scan and therefore the

statistics sample

Max patterns to draw Chart clarity vs completeness

Show Statistics Dashboard Dashboard on/off

Colours and font size Full visual control


Who it is for


Suited to traders who already understand harmonic patterns and want the

donkey work automated plus evidence attached - and to intermediate traders who

know the shapes but are not sure which ones to trust.


It is genuinely useful for swing and intraday traders on any instrument and any

timeframe: forex, indices, commodities and crypto all work, because the logic

is pure price geometry.


If you have never met a harmonic pattern before, read up on the basics first.

The indicator will find them for you, but it assumes you know what a Gartley is

trying to tell you.


Typical use


1. Attach to a chart and let the dashboard build its sample.

2. Look at which pattern types actually perform on that instrument and

timeframe, and switch the weak ones off.

3. Wait for a fresh completion at D, checking the accuracy score and that

type's historical hit rate.

4. Use the drawn entry, stop and targets as the plan, sized to your own risk.


Important notes - please read


- This is an ANALYSIS TOOL. It does not place, modify or close any order.

There is no auto-trading and it never touches your account.


- Past performance is not a prediction. The dashboard reports what these

patterns did historically on the loaded data. It is evidence for a

decision, not a guarantee of the next one.


- Statistics need a sample. cTrader only gives an indicator the bars the

chart has actually loaded, so scroll back to load history before judging

the numbers - the difference between a few hundred bars and several

thousand is the difference between noise and a usable sample.


- Returns are shown as a percentage of price. A forex pair will naturally

show smaller percentages than an index or a commodity; compare like with

like.


- Entry fill rates are realistically low by design. Many harmonic setups

never fill because price runs away from D first. The indicator counts

those honestly as unfilled rather than flattering the statistics.


- Deep scans do real work. If you push the bar count high on a slow machine

and see a pause on each new bar, reduce Historical Bars to Scan or raise

the minimum pivot depth.


Analysis only. No DLLs. No external connections. It never sends, modifies or

closes an order.


概要

インジケーターのプロフィール
インジケーターのカテゴリー
パターン
出力の種類
ビジュアル表示
シグナル
データ要件
バーのみ
サポート対象のシグナル
反転
ラインタッチ

カスタマーレビュー

0.0
レビュー: 0
カスタマーレビュー
この商品にはまだレビューがありません。お使いになったことがある方は、ぜひレビューをお願いします。

ディスカッション

よくあるご質問

Support & Resistance
cTrader Storeで入手可能な取引ボット、インジケーター、プラグインなどの商品は、第三者の開発者が提供するものであり、情報と技術の取得のみを目的としてご利用いただけます。cTrader Storeはブローカーではなく、投資助言や個人的な推奨を行うことも、将来のパフォーマンスを保証することもありません。

これも好きかも

インジケーター
Key Levels
Market Structure
+1
Sessions, ICT killzones, multi-ORB and previous levels. One clean, no-repaint cTrader overlay.
インジケーター
Forex
cTrader Auto Support & Resistance detects key levels with Fibonacci analysis and sends real-time trading alerts.
インジケーター
BOS
CHOCH
+3
Identifies HH, HL, LH, and LL swing points using fractals. Essential for Smart Money Concepts and price action.
インジケーター
EMA
A visual signal backtester that simulates trades directly on your chart and scores strategy performance.
インジケーター
Pin Bar
Inducement
+5
Institutional Nasdaq Session Liquidity Map with Live Point HUD, Sweep Alerts & Interactive Playbook.
インジケーター
ATR
Volume
+5
Order blocks with measured hold-rate stats and confidence scoring — not just zones on a chart.
「ZigXRay」ロゴ
トップ評価
4.6
(5)
インジケーター
CHOCH
Key Levels
+5
ZigZag Market Structure Identifier - Multi-Layer Scanner: Convergent Pivot Detection, 4-TF Overlay & Naked Chart Mode.
インジケーター
Moving Average
An Indicator made for scalping. Shows you the Sniper movement on Chart with the colour signals.
インジケーター
Key Levels
Liquidity Grab
+2
A practical XAUUSD workspace for mapped levels, session context, liquidity events, alerts and risk planning.
インジケーター
Key Levels
Market Structure
+1
HTF Candle Projector displays the current Higher Timeframe candle (4H or 1H) as a real projected candle LIVE..
インジケーター
RSI
Forex
+10
Unlock Stochastic RSI PRO in cTrader! Overlay RSI, highlight zones, and identify divergences with customizable settings.
インジケーター
Signal
Breakout
+1
Bolliger Bands + Hamster-Coder™ Timeframe Decoupling
インジケーター
Plot higher-timeframe Bollinger Bands for clearer structure, pullback zones, and breakout signals—without switching char
インジケーター
EURUSD
GBPUSD
+3
All-in-one suite for ICT concepts: NY Midnight Open, Killzones, automatic Liquidity levels (PDH/L, PWH/L).
インジケーター
Forex
BTCUSD
+11
Visualize trends with Standard Deviation Channel! Display median, and add customizable upper/lower deviation channels.
インジケーター
AI
ATR
+27
Overbought Oversold Indicator
「Dem」ロゴ
トップ評価
4.2
(4)
インジケーター
Forex
BTCUSD
+5
Scalping indicator for Renko 100 using EMAs to show trend and entry zones with clear colored rectangles.
インジケーター
Key Levels
Spots key hourly ranges and signals breakouts using arrows & colored background zones. Ideal for Gold.

価格

登録日 22/07/2026