present
Daftar dan dapatkan diskon $50 untuk pembelian pertama Anda
Trading product for TradeLens Indikator Chart UI Tools Key Levels, image 1
TradeLens
Indikator
Versi 1.0, Sep 2026
Windows, Mac
Trading product for TradeLens Indikator Chart UI Tools Key Levels, image 2
Trading product for TradeLens Indikator Chart UI Tools Key Levels, image 3
Trading product for TradeLens Indikator Chart UI Tools Key Levels, image 4
Trading product for TradeLens Indikator Chart UI Tools Key Levels, image 5
Trading product for TradeLens Indikator Chart UI Tools Key Levels, image 6
Trading product for TradeLens Indikator Chart UI Tools Key Levels, image 7
Trading product for TradeLens Indikator Chart UI Tools Key Levels, image 8
Sejak 09/02/2026
20
Penjualan
152
Instal gratis

Deskripsi

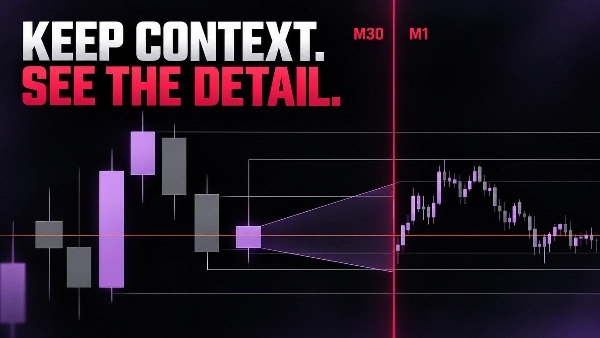
TRADELENS - KEEP CONTEXT. SEE THE DETAIL.

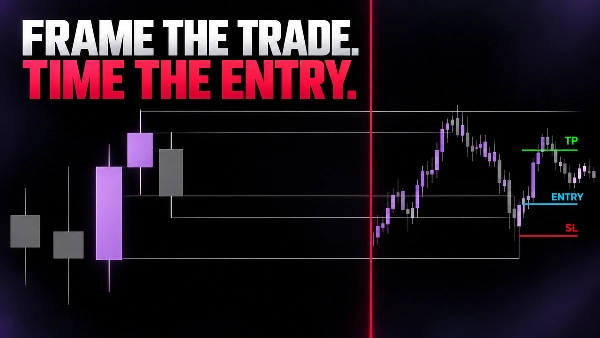
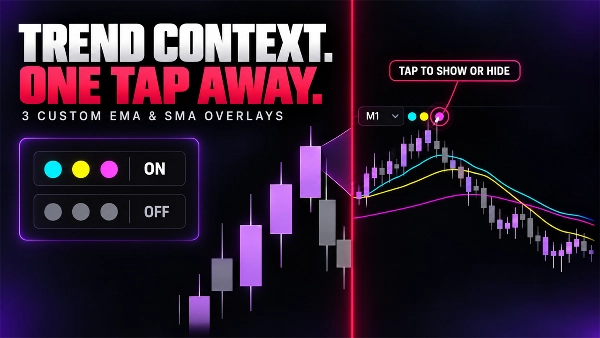
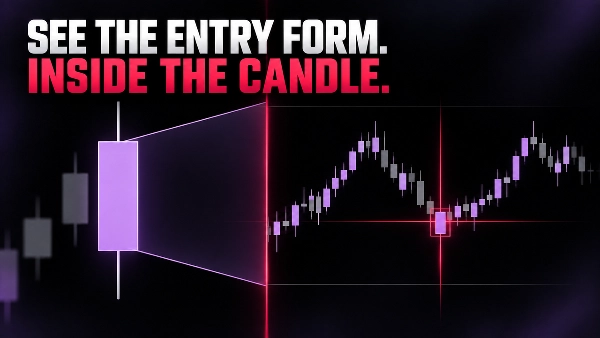
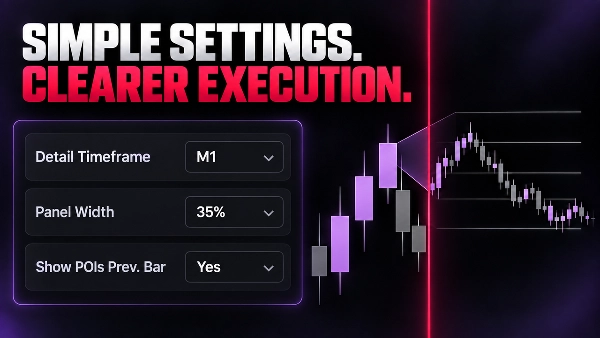
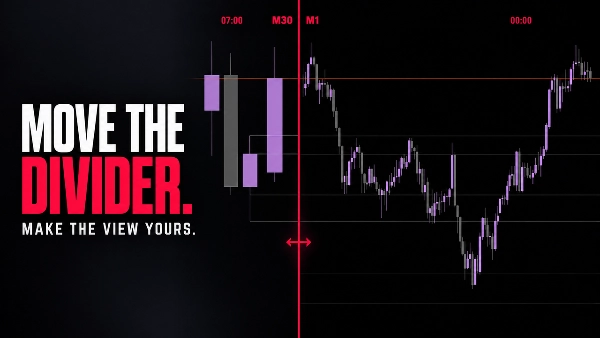
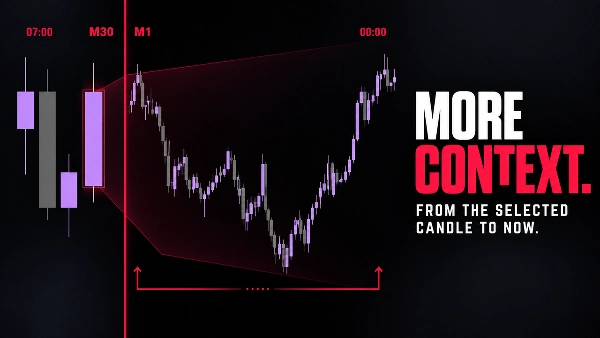
TradeLens places a compact lower-timeframe candle view directly inside your current chart. The original chart remains your higher-timeframe context; the detail panel shows how price is developing inside the selected context candle.

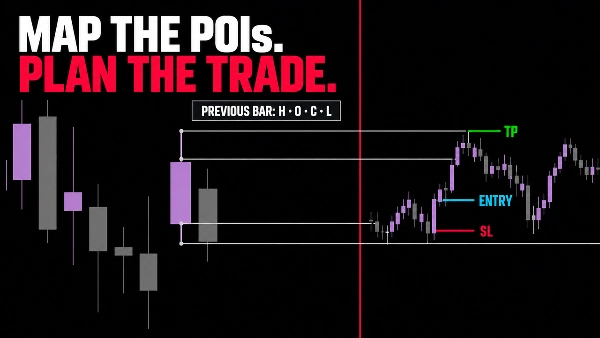
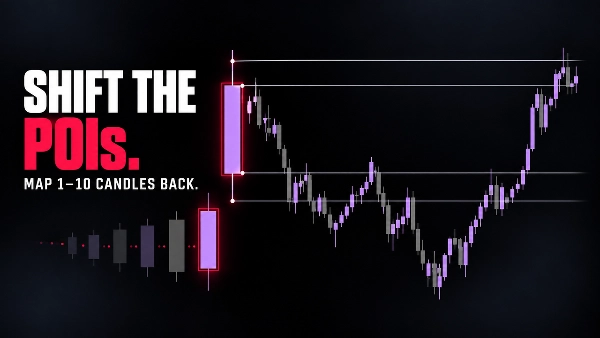
Use the current forming candle by default, or shift back to inspect an earlier context candle. You can frame the active setup with optional POI's (rays) at the previous closed bar's High, Low, Open and Close, then study the lower-timeframe movement without leaving the chart.

WHAT TRADELENS HELPS YOU SEE

  • Higher-timeframe structure and lower-timeframe detail in the same window.
  • The progression of the current context candle at a finer scale.
  • Previous-bar OHLC points of interest across the chart.
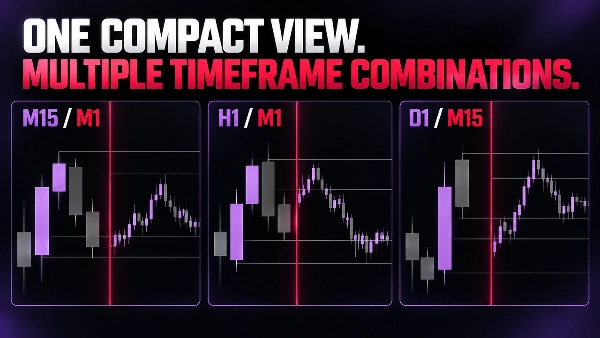
  • Compact combinations such as M15/M1, M30/M1, H1/M1, D1/M15 and D1/M30.
  • A cleaner way to refine entry timing while preserving context.

SIMPLE, VISUAL CONTROLS

  • Detail timeframe and context candle shift.
  • Detail-panel width, background and opacity.
  • Bull, bear, separator and label colors.
  • Optional previous-bar POIs with configurable color and thickness.

The detail timeframe must be smaller than the chart timeframe. If the combination is invalid, TradeLens hides its visualization and displays a clear configuration banner.

TradeLens is a visual analysis tool. It does not place, modify or manage orders. Examples shown in the gallery illustrate a chart-reading workflow and are not trade recommendations or guarantees of performance.


Ringkasan

Ringkasan AI
TradeLens is a chart visualization tool designed to integrate two timeframes within a single trading chart. It embeds a compact lower-timeframe candle view inside the current higher-timeframe chart, allowing traders to observe detailed price action within the context of a broader market structure. Users can analyze the progression of the current or previous context candles at a finer scale without switching charts.

Key features include optional points of interest (POIs) marking the previous bar’s Open, High, Low, and Close levels, customizable visual settings such as detail panel size, background opacity, and color schemes for bullish, bearish, and separator elements. TradeLens supports common timeframe combinations like M15/M1, M30/M1, H1/M1, D1/M15, and D1/M30, ensuring the detail timeframe is always smaller than the context timeframe.

This tool facilitates refined entry timing by preserving higher-timeframe context while providing granular lower-timeframe insights. It is a visual analysis indicator and does not execute or manage trades. TradeLens is tagged under market structure and chart UI tools, supporting analysis related to key levels, liquidity sweeps, market structure changes, and inducements.
Profil indikator
Kategori indikator
Struktur pasar (SMC)
Tipe output
Visualisasi
Persyaratan data
Hanya batang

Ulasan pelanggan

0.0
Ulasan: 0
Ulasan pelanggan
Belum ada ulasan untuk produk ini. Sudah mencobanya? Jadilah pemberi ulasan pertama!

Diskusi

Pertanyaan umum

Chart UI Tools
Key Levels
Liquidity Sweep
CHOCH
Inducement
Market Structure
Liquidity Grab
Produk-produk yang tersedia melalui cTrader Store, termasuk bot trading, indikator, dan plugin, disediakan oleh pengembang pihak ketiga serta hanya ditujukan untuk akses teknis dan informasi. cTrader Store bukan broker dan tidak menyediakan saran investasi, rekomendasi pribadi, atau jaminan apa pun tentang kinerja di masa mendatang.

Produk lain dari penulis ini

Indikator
BOS
CHOCH
+5
Spot market structure shift with ease, overlay timeframes, avoid false breakouts with open close pivots, hide chart bars
Indikator
Volume
Imbalance
+5
Spot Institutional Order Flow with Proportional Volume Bubbles & Integrated Cumulative Volume Delta (CVD) Intelligence.
Logo "ZigXRay"
Peringkat teratas
4.6
(5)
$29
/
$49
Indikator
CHOCH
Key Levels
+5
ZigZag Market Structure Identifier - Multi-Layer Scanner: Convergent Pivot Detection, 4-TF Overlay & Naked Chart Mode.
Indikator
Forex
EURUSD
+5
Fimathe Indicator - Fimathe PCM - Automated Trend Channels & Levels — Ideal for live trading and backteting
cBot
Fixed Lot
TP Manager
+5
Hotkeys Trading Assistant - Professional Shortcut Assitant with Risk Manager, Hotkeys & Lot Sizing.
Plugin desktop
Risk/Reward
Trade Journal
+5
cTrader Journal - Automatic Trade Capture. Offline Reviews. No Subscription.
Logo "DrbcLevels"
Peringkat teratas
4.0
(4)
$19
/
$29
Indikator
Key Levels
Break & Retest
+5
Premium Discount Levels - Professional Dealing Range Zones with Draggable Lines, Alerts, Wartermark & Backtest Mode.
Logo "fvg_levels"
Peringkat teratas
4.0
(4)
$19
/
$29
Indikator
Key Levels
Order Block
+5
FVG Levels — Auto-Detection of Multi-Timeframe Fair Value Gaps & GAPs, Smart Filters and Liquidity Zone Monitoring

Anda mungkin juga suka

Indikator
ATR
Forex
+9
Auto-detect swing highs/lows. Spot reversals, map structure, and filter noise with adjustable strength.
Indikator
Forex
Real-Time Candlestick Pattern Detection with Custom Alerts & Trend Analysis for cTrader
Indikator
SMC
Forex
+4
Identifies institutional zones with Volume Delta (K) across any asset or chart for high-precision entry detection.
Indikator
Fisher Transform with smoothing. Spot reversals and cycles with precision. Great for any market, any timeframe.
Indikator
Forex
GBPUSD
+5
Visual warning zones for high-impact news so you can manage risk before volatility hits.
Indikator
Volume
Channel
+3
A higher-timeframe log-regression channel with a volume profile, Point of Control and session levels.
Indikator
ATR
RSI
+5
Supply and demand zones with break of structure, higher timeframe MA signals, a percent stop and three targets.
Indikator
RSI
Breakout
+1
Dynamically adjusts regression channels based on ZigZag extremes, resetting when price breaks bands to track real trends
Indikator
Signal
Fractal Arrow Buy and Sell Indicator
Indikator
Indices
Breakout
+1
You can use the cTrader Pivot Points Pro indicator to find a good pullback entry in a trend
Indikator
ADX
ATR
+5
Ten confluence layers scored on every closed bar, with an anti-chop gate, pivot levels and a live dashboard.
Indikator
Shows BUY & SELL signals for 3 & 4 BAR PATTERN (Morning star/ Evening star). It is adjustable and it will SHOW ARROWS.
Indikator
AI
ATR
+27
🔮 Smart Bar Predictor - Professional Volatility Forecasting Indicator
Indikator
MSS
Key Levels
+2
Fractal based market structure indicator that identifies HH, HL, LH, and LL pivot with confirmed, non-repainting fractal
Indikator
ATR
Volume
+3
Fibonacci trend signals on closed bars, with an ATR stop, up to four targets and a break-even ladder.
Indikator
ATR
RSI
+6
Market structural patterns , specifically the concepts of Change of Character (ChoCH) 🔄 and Break of Structure (BoS) 💥
Indikator
Volume
Channel
+2
Identify key support and resistance levels through detailed volume distribution analysis.
Indikator
ATR
RSI
+4
Adaptive Ichimoku with nine-factor confluence scoring, five signal types, smart TP/SL and an MTF panel.

Harga

Sejak 09/02/2026
20
Penjualan
152
Instal gratis