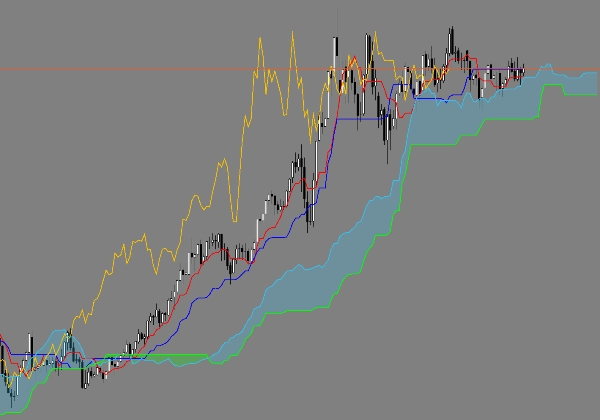
중개인 및 프랍
비즈니스용
00
Days
:
00
Hours
:
00
Minutes
:
00
Seconds
Ichimoku Kinko Hyo
"Ichimoku Kinko Hyo" 로고
가입일 20/03/2025
무료 설치
61
"Ichimoku Kinko Hyo" 업로드된 이미지

This is a corrected Ichimoku Kinkō Hyō indicator for cTrader. By default, cTrader’s displacement is 26 and starts counting from zero, which causes the Chikou Span and the Kumo (cloud) to be shifted incorrectly. This version fixes that by using a fixed 25-period shift for both the Chikou Span (moved 25 periods back) and Kumo lines (moved 25 periods forward), matching the original Japanese specification and platforms like TradingView. This ensures all Ichimoku lines are calculated and plotted in the correct positions for accurate signals and analysis.

0.0
리뷰: 0
고객 리뷰
이 상품에 대한 리뷰가 아직 없습니다. 이미 사용해 보셨나요? 다른 사람들에게 가장 먼저 소개해 주세요!
좋아하실 만한 다른 항목
지표
Grid
NAS100
NZDUSD
+15
EMA UP&DOWN 2025
SectorIndex Dual Moving Average Indicator: Your Market Compass 🧭
Fury Team E_M_A_su_TF
EMA ON TF (MULTI-TIMEFRAME)
지표
Breakout
XAUUSD
Forex
+2
McDonalds Pattern-Bzier Curve
Designed to identify and visualize price reversal patterns using Bézier curves.
지표
RSI
Breakout
XAUUSD
+6
Order Block
Identify bullish and bearish Order Blocks to spot key support/resistance levels and potential trend reversals! 📈🔄
지표
VWAP
VWAP - London Open
VWAP Set to London Open
지표
NAS100
NZDUSD
XAUUSD
+13
MACD Histogram PRO
Enhance MACD Histogram! Visualize bull and bear price changes with vibrant colors for clearer, more insightful trading.
지표
Indices
Forex
EURUSD
+2
US Dollar Index
US Dollar Index
지표
Indices
Forex
USDJPY
JPYX w HMA
JPYX Indicator with HMA
지표
NAS100
NZDUSD
XAUUSD
+12
Candlehtf
MultiFrameCandles para cTrader: La Herramienta Definitiva para Dominar Cualquier Marco de Tiempo
지표
NAS100
RSI
Indices
+7
QX FrameForge
Multi-timeframe market-state dashboard: Score (-100..+100) + UP/NEUT/DN per TF, with optional closed-candle arrows.
지표
VWAP
RSI
XAUUSD
+9
Turtle Soup ICT Strategy
Turtle Soup ICT Strategy – Detect liquidity traps & trade smart money moves with precision on cTrader.
Reversal Probability Engine
Detecting reversal zones + multidimensional mapping of support and resistance "Golden Levels.
지표
Indices
Commodities
Stocks
+2
XY Bar Info Panel v1.5
Overlay panel showing bar date/time, OHLC, tick Volume, percent change, and market session - fully customizable.
지표
RSI
Breakout
Lozano Price Action
LPA simplifies trading by coloring candles with volume data and RSI levels for trend and reversal insights.
Supply Demand - BasicV1
Supply and demand zones. They're important. Here's a free version to get you started!
지표
Indices
RSI
Stocks
+5
REDGREENZONEREVERSAL
The Red & Green Zone Reversal Indicator detects overbought and oversold market conditions using Bollinger Bands and RSI.
DMI CUSTOM SESSIONS
This will allow you to have SESSIONS on the chart. London, New York, Asian session and you can customize the times.
지표
Indices
Prop
Stocks
+3
Nadaraya-Watson Kernel Regression
Ultra-smooth adaptive trend line via Gaussian kernel regression — low lag, clean structure.