Descripción
📈 RSI Estocástico
El RSI Estocástico es un oscilador de momentum que aplica la fórmula estocástica a los valores del RSI en lugar del precio, convirtiéndolo en un indicador de segunda derivada. Es particularmente útil para identificar condiciones de sobrecompra y sobreventa con mayor sensibilidad que el RSI estándar.
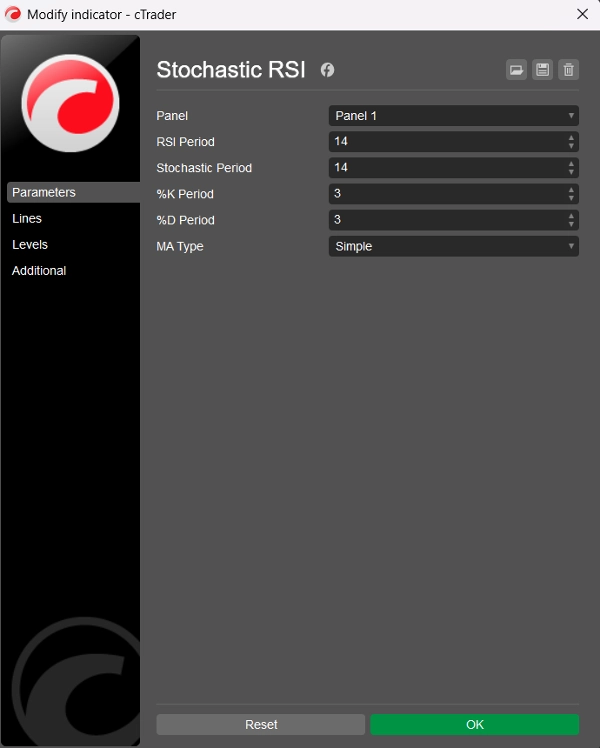
🛠️ Parámetros
Periodo RSI: El período de retroceso utilizado para calcular el RSI base (por defecto = 14)
Periodo Estocástico: El período de retroceso aplicado a los valores del RSI para calcular el RSI Estocástico (por defecto = 14)
Periodo %K: El período de suavizado para la línea %K (por defecto = 3)
Periodo %D: El período de suavizado para la línea %D (por defecto = 3)
Tipo de MA: Tipo de media móvil para el suavizado: Elección entre 11 tipos (por defecto = Simple)
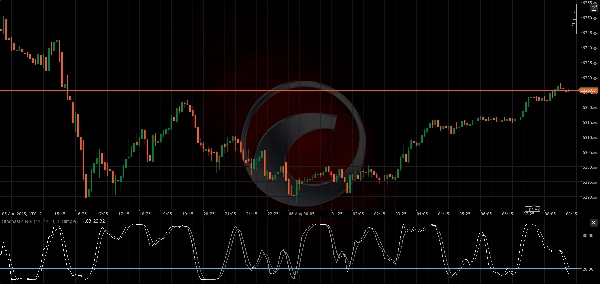
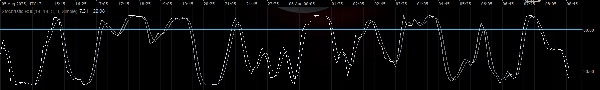
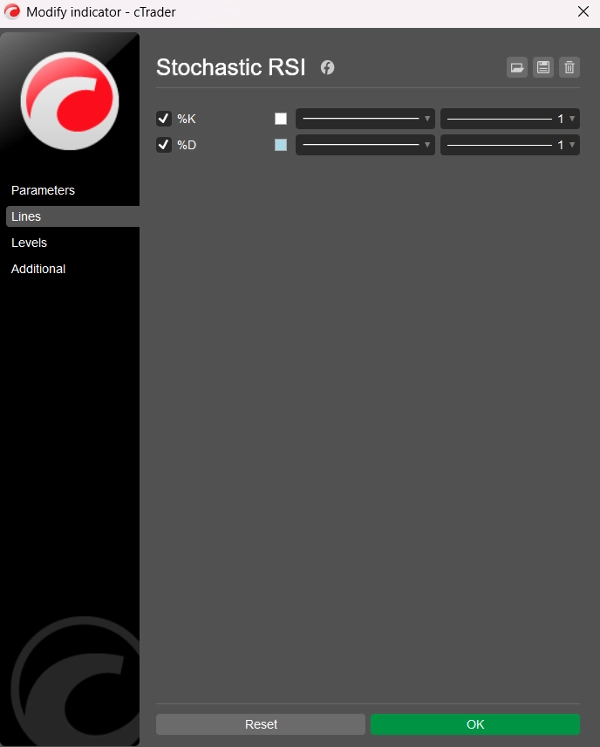
📊 Líneas de Salida
- Línea %K: RSI Estocástico suavizado (blanco)
- Línea %D: Media móvil suavizada de %K (azul claro)
Ambas líneas oscilan entre 0 y 100, permitiendo lecturas claras de sobrecompra y sobreventa.
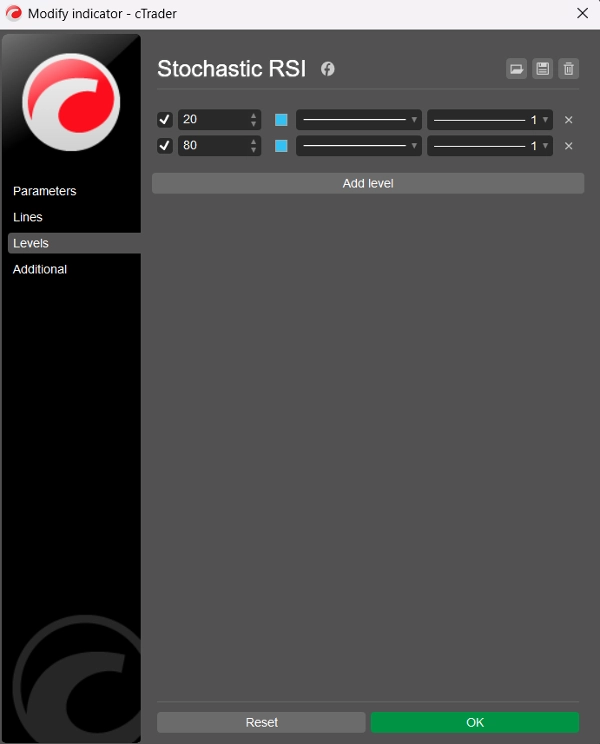
⚠️ Niveles Sugeridos
Aunque el indicador no muestra niveles estáticos por defecto, se recomienda a los usuarios añadir estos manualmente a través de la pestaña “Niveles” en cTrader:
- Nivel 80 → Sobrecompra
- Nivel 20 → Sobreventa
Estos niveles funcionan de manera similar al Oscilador Estocástico tradicional pero aplicados al comportamiento del RSI, haciendo que las señales sean más nítidas y a menudo más rápidas.
🧠 Cómo Usar
- Sobrecompra (>80): Puede indicar que el precio está sobreextendido al alza — potencial para reversión o consolidación.
- Sobreventa (<20): Puede señalar que el precio está sobrevendido — posible rebote o reversión de tendencia.
- Cruces %K y %D: Pueden usarse de manera similar al Estocástico o MACD — un cruce alcista por debajo de 20 o un cruce bajista por encima de 80 puede ser accionable.
🏷️ Notas
- Desarrollado para cTrader usando C# y la API Automate
- Limpio, eficiente y personalizable con 11 tipos de MA
- Código y lógica por BlueRocketBots & ChatGPT (OpenAI)
- Código limpio (total 99 líneas; 54 líneas de código, 27 líneas de texto, 18 líneas vacías)
- Versión mejorada V2
- ¡Gratis!
Resumen
Key parameters include the RSI Period (default 14), Stochastic Period (default 14), %K and %D smoothing periods (default 3 each), and a choice among 11 moving average types for smoothing (default is Simple). The indicator outputs two lines: the %K line (smoothed Stochastic RSI) and the %D line (smoothed moving average of %K), both oscillating between 0 and 100.
Suggested manual levels for interpretation are 80 (overbought) and 20 (oversold). Traders may use these levels along with %K and %D crossovers to identify potential price reversals or consolidations. For example, a bullish crossover below 20 or a bearish crossover above 80 can signal actionable market moves.
The indicator is implemented in clean, efficient C# code using the Automate API, allowing customization and integration within cTrader.