
설명
MarketSessions – 당신의 거래 우위, 시각화됨
시장 시간을 거래력으로 바꾸세요
MarketSessions 은 글로벌 시장 세션을 생생하게 보여주는 전문 등급의 cTrader 지표로, 모멘텀이 진짜인 곳에서 거래하고 타이밍을 당신의 우위로 만듭니다.
🚀 왜 트레이더들이 MarketSessions를 신뢰하는가
시장 리듬을 보세요
런던, 뉴욕, 도쿄, 시드니 – 그리고 원하는 다른 세션들을 즉시 시각화하세요 – 차트에 맞게 조정되는 깔끔하고 우아한 오버레이로.
더 스마트하게 거래하세요, 늦지 않게
세션이 열리거나 닫히거나 주요 레벨에 도달할 때 실시간 알림을 받으세요 – 텔레그램 또는 디스코드(선택 가능)를 통해 전달됩니다.
고확률 구역을 공략하세요
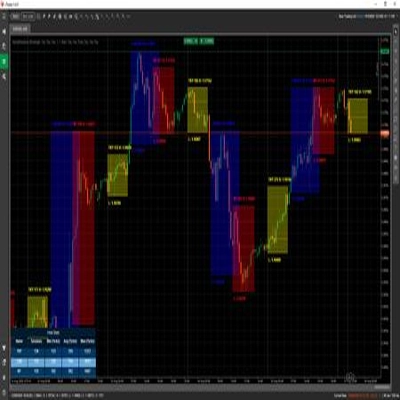
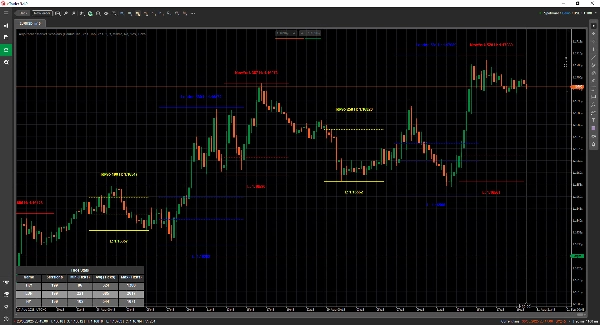
내장 도구인 개장 범위 돌파, 포인트 오브 컨트롤(POC) 및 정밀 세션 라인 을 활용하여 돌파나 반전을 놓치지 마세요.
🎯 주요 기능
- 세션 시각화 및 관리 – 겹치는 시장도 포함하여 완전히 사용자 지정 가능한 시간, 색상 및 라벨
- 고급 그리기 도구 – 더블 ❘❘ 및 중간선 그리기 도구, 돌파 사각형, 텍스트 마커 및 더블 라인 모드 포함, 미니멀리스트 트레이더용
- 통계 패널 – 각 세션의 총 세션 수, 최소, 평균 및 최대 범위 보기(틱, 핍 또는 % 단위)
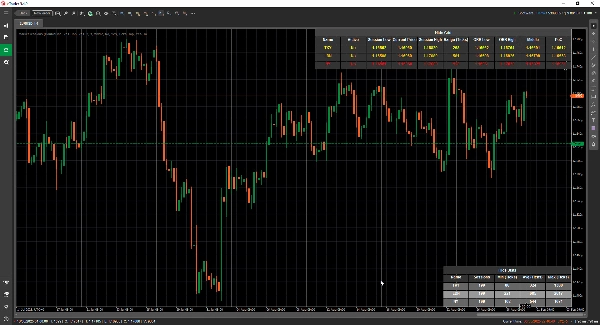
- 그리드 모드 - 현재 활성 세션을 표로 볼 수 있어 상위 타임프레임에서 세션을 확인할 수 있습니다.
- 유연한 구성 – 텍스트 위치, 범위 모드, 그리기 선호도 및 테마 사용자 지정
- 알림 및 통합 – 사운드 및 시각적 알림이 포함된 텔레그램/디스코드 통합
📦 제공 내용
- MarketSessions.algo (즉시 사용 가능)
- 평생 업데이트 (반복 요금 없음)
- 친절한 지원 (도움이 필요할 때 직접 접근 가능)
💻 요구 사항
- cTrader 플랫폼
- .NET 6.0 런타임
✅ 몇 분 만에 설치
✅ 절대적인 자신감을 가지고 거래하세요
📘 매개변수 참조 (친절한 버전)
사용 가능한 세션 목록
- 뉴욕
- 런던
- 프랑크푸르트
- 도쿄
- 홍콩
- 상하이
- 싱가포르
- 웰링턴
- 시드니
- 토론토
일반 설정
- 그리기 모드 – 세션 라인이 차트에 그려지는 방식을 선택하세요 (사각형 / 더블 라인 / 중간선)
- 세션 이름 표시 – 각 세션 이름을 차트에 직접 표시
- 세션 이름 위치 – 세션 이름 텍스트가 나타나는 위치 결정 (상단, 중앙, 하단)
- 텍스트 굵게 – 세션 이름을 읽기 쉽게 굵게 만듭니다
- 상단 텍스트 오프셋 – 상단에서 추가 간격을 추가하여 텍스트가 캔들과 겹치지 않도록 함
- 하단 텍스트 오프셋 – 세션 영역 하단에서 추가 간격을 추가
- 텍스트 시간 위치 – 세션 이름과 함께 세션 시간을 표시
- 짧은 세션 이름 사용 – 짧은 이름으로 전환 (예: 뉴욕 대신 NY)
- 세션 범위 표시 – 세션이 포함하는 전체 가격 범위를 강조 표시
- 세션 범위 모드 – 가격 범위 계산 방식 선택 (고가/저가 또는 시가/종가)
- 세션 범위 위치 – 범위 마커를 상단 또는 하단에 배치
- 고가 표시 – 세션의 최고 가격 표시
- 고가 위치 표시 – 고가 라벨이 나타나는 위치 선택
- 저가 표시 – 세션의 최저 가격 표시
- 저가 위치 표시 – 저가 라벨이 나타나는 위치 선택
- 고가/저가 라인 연장 (분) - 이 라인들을 x분 앞으로 연장할 수 있음
- 개장 범위 돌파 표시 – 세션 시작 시 돌파 박스 그리기
- ORB 라인 연장 (분) - 이 라인들을 x분 앞으로 연장할 수 있음
- 중간선 표시 – 공정 가치를 식별하는 데 도움이 되는 중간선 추가
- 중간선 연장 (분) - 이 선을 x분 앞으로 연장할 수 있음
- PoC 표시 – 컨트롤 포인트(세션에서 가장 많이 거래된 가격) 표시
- 중간선 연장 (분) - 이 선을 x분 앞으로 연장할 수 있음
- 채워진 투명도 – 세션 배경 채우기의 투명도 조절
통계
- 통계 그리기 – 차트에서 통계 패널 표시/숨기기
- 통계 가로 정렬 – 패널 정렬 (왼쪽 / 중앙 / 오른쪽)
- 통계 세로 정렬 – 패널이 상단 또는 하단에 나타날지 선택
- 제목 색상 – “통계” 제목의 텍스트 색상
- 짝수 행 색상 – 패널의 짝수 행 배경 색상
- 홀수 행 색상 – 패널의 홀수 행 배경 색상
- 전경 색상 – 패널 내부에 사용되는 텍스트 색상
텔레그램
- 사용 – 텔레그램 알림 활성화 또는 비활성화
- 토큰 – 당신의 텔레그램 봇 토큰
- 채팅 ID – 알림이 전송될 채팅 ID
디스코드
- 사용 – 디스코드 알림 활성화 또는 비활성화
- 웹훅 URL – 세션 알림 전송용 디스코드 웹훅 URL
사운드 알림
- 새 세션 사운드 알림 – 새 세션이 시작될 때 소리 재생
- 세션 완료 사운드 알림 – 세션이 종료될 때 소리 재생
그리드
- 강제 그리드 - 사용 중인 타임프레임과 상관없이 그리드 렌더링 강제 적용
- 이상 타임프레임에서 그리드 표시 - 이 타임프레임 이상에서 그리드가 표시되도록 선택 가능
- 메시지 박스 알림 - 일반 렌더링 모드가 불가능한 이유를 알리고 그리드 모드로 전환
- 그리드 가로 정렬
- 그리드 세로 정렬
세션 예시 (뉴욕)
⚠️ 동일한 매개변수가 각 세션(런던, 도쿄, 시드니 등)에 적용됩니다
- 활성화 – 이 특정 세션을 활성화 또는 비활성화
- 색상 – 차트에 사용되는 세션 색상
- 영역 채우기 – 세션 영역 배경 채우기
- 선 스타일 – 선 스타일 선택 (실선, 점선 등)
- 선 두께 – 세션 경계선 두께 조절
시장의 시계를 당신의 동맹으로 만드세요
오늘 MarketSessions를 사용하여 수익성 있는 세션을 절대 놓치지 마세요.
요약
지표 프로필
고객 리뷰
0.0
리뷰: 0
고객 리뷰
이 상품에 대한 리뷰가 아직 없습니다. 이미 사용해 보셨나요? 다른 사람들에게 가장 먼저 소개해 주세요!
상담
자주 묻는 질문(FAQ)
Forex
EURUSD
GBPUSD
NZDUSD
USDJPY
트레이딩 봇, 지표, 플러그인 등 cTrader Store에서 제공되는 상품은 제3자 개발자에 의해 제공되며, 이는 단순히 정보 및 기술적 접근을 목적으로 제공된 것입니다. cTrader Store는 중개인이 아니며, 투자 조언, 개인별 추천 또는 향후 성과에 대한 어떠한 보장도 제공하지 않습니다.
이 작성자의 상품 더 보기


좋아하실 만한 다른 항목


가격
10
판매
351
무료 설치