설명
얼티밋 RSI (상대 강도 지수)
The Ultimate RSI는 시장 모멘텀과 추세 강도를 보다 부드럽고, 명확하며, 반응성이 뛰어나게 읽을 수 있도록 설계된 고급 맞춤형 오실레이터입니다. 이는 전통적인 상대 강도 지수(RSI)를 크게 업그레이드한 것으로, 시장 잡음을 걸러내고 잘못된 신호(휘핑)를 최소화하는 데 중점을 둡니다. 이로 인해 추세를 확인하고 신뢰할 수 있는 전환점을 정확히 찾아내는 데 매우 유용한 도구가 됩니다.
주요 특징 및 개선 사항:
- 강화된 모멘텀 계산: 이 지표는 가격 변동을 계산하는 정교한 방법을 사용합니다. 일일 가격 변동에만 의존하는 대신, 모멘텀 신호는 조회 기간 내에 가격이 새로운 고점이나 저점을 기록할 때 크게 강화됩니다. 이 과정은 지표가 진정한 돌파에 강력하게 반응하면서도 사소하고 불규칙한 움직임은 무시하도록 보장합니다.
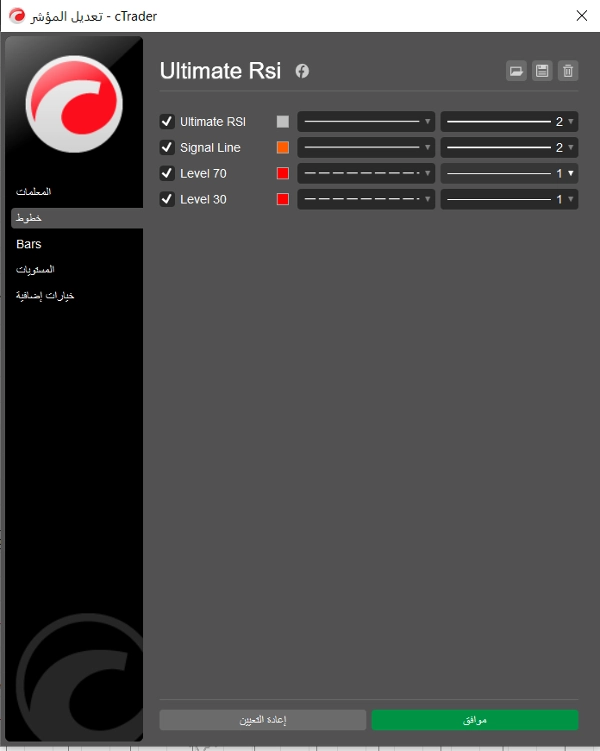
- 전용 신호선: RSI 자체의 이동평균인 별도의 신호선을 포함하며, 독립적으로 설정할 수 있습니다. 얼티밋 RSI 선과 신호선 간의 교차는 특히 과매수/과매도 수준 근처에서 진입 또는 청산을 위한 더 명확하고 신뢰도 높은 신호로 자주 사용됩니다.
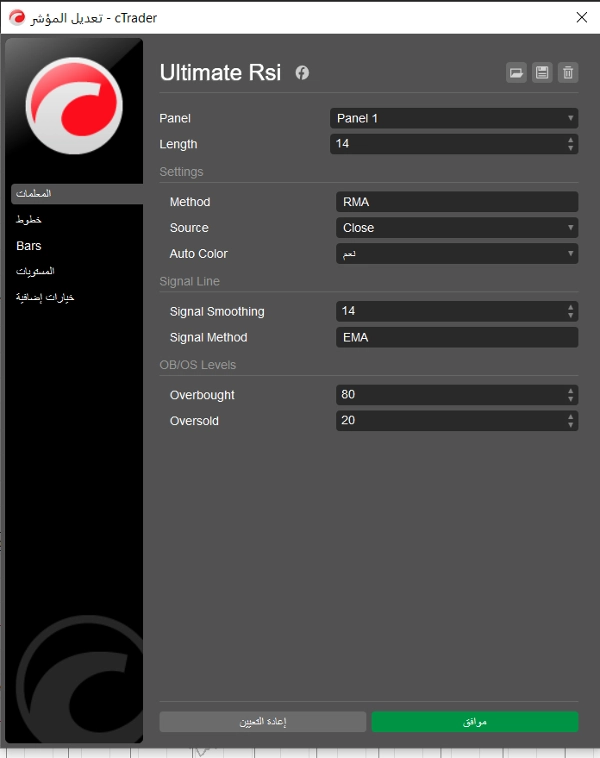
- 유연한 평활화 방법: 사용자는 RSI 계산과 신호선 모두에 대해 일반적인 옵션 중에서 평활화 유형을 선택할 수 있습니다: EMA (지수 이동평균), SMA (단순 이동평균), RMA (와일더 이동평균), 그리고 TMA (삼각 이동평균). 이를 통해 지표의 민감도를 정밀하게 맞춤 설정할 수 있습니다.
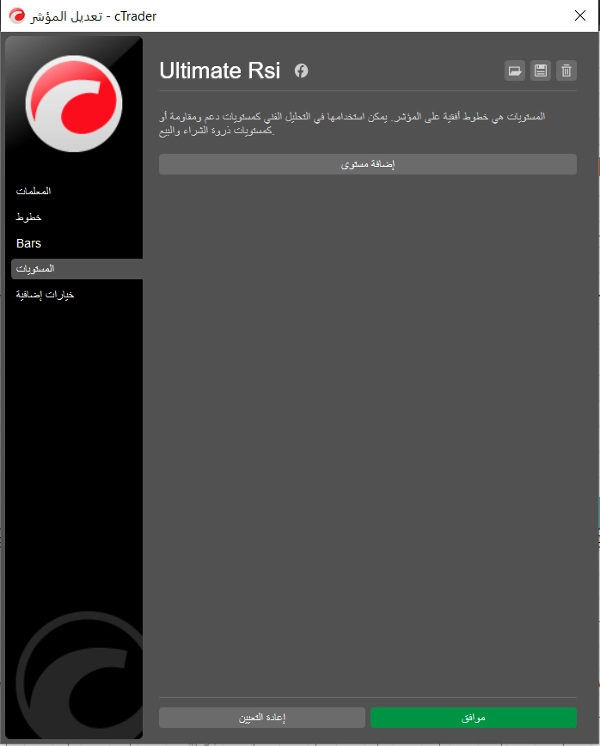
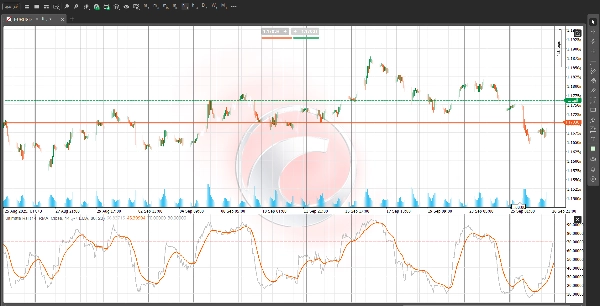
- 시각적 과매수/과매도 구역: 기본 과매수(OB) 수준인 80과 과매도(OS) 수준인 20가 배경 음영으로 명확히 표시됩니다. 강한 추세 시장에서는 이 구역 내에서 지속되는 수치가 즉각적인 반전보다는 뛰어난 추세 강도를 나타내는 경우가 많아, 추세 추종 전략에 강력한 확인 도구를 제공합니다.
얼티밋 RSI를 활용한 거래 방법:
- 추세 확인: 모멘텀 중심으로 50 레벨을 사용하세요. 50 이상에서 지속적으로 읽히면 강세 편향을 확인하며, 50 이하에서는 약세 편향을 확인합니다.
- 진입 신호: 얼티밋 RSI 선이 신호선을 상향 돌파하면 잠재적 매수 진입 신호이며, 신호선을 하향 돌파하면 잠재적 매도 진입 신호입니다. 이 교차가 50 레벨과 관련하여 어디에서 발생하는지 주의 깊게 관찰하세요.
- 노이즈 감소: 진정한 변동폭 확장에 중점을 두고 고급 평활화를 활용함으로써, 얼티밋 RSI는 조정 기간 동안 트레이더가 집중력을 유지하도록 도와 조기 진입 또는 청산을 방지합니다.
면책 조항: 이 설명은 정보 제공 및 교육 목적으로만 작성되었습니다. 거래에는 위험이 따르며, 모든 지표 신호는 거래 결정을 내릴 때 종합적인 가격 행동 분석과 함께 사용해야 합니다.
요약
지표 프로필
고객 리뷰
0.0
리뷰: 0
고객 리뷰
이 상품에 대한 리뷰가 아직 없습니다. 이미 사용해 보셨나요? 다른 사람들에게 가장 먼저 소개해 주세요!
상담
자주 묻는 질문(FAQ)
Prop
Forex
Indices
Supertrend
Commodities
RSI
Crypto
Stocks
ATR
트레이딩 봇, 지표, 플러그인 등 cTrader Store에서 제공되는 상품은 제3자 개발자에 의해 제공되며, 이는 단순히 정보 및 기술적 접근을 목적으로 제공된 것입니다. cTrader Store는 중개인이 아니며, 투자 조언, 개인별 추천 또는 향후 성과에 대한 어떠한 보장도 제공하지 않습니다.
좋아하실 만한 다른 항목


가격
가입일 03/09/2025