
Описание
Trend Pullback Profiler
Trend Pullback Profiler — это индикатор cTrader, созданный для анализа того, как тренд дышит, измеряя глубину и частоту откатов – теперь также в процентах коррекции Фибоначчи.
Используя трендовый фильтр на основе EMA, индикатор:
- определяет, когда установлен явный восходящий тренд или нисходящий тренд;
- выделяет каждый подтверждённый откат в рамках этого тренда;
- измеряет глубину отката в пунктах;
- вычисляет процент коррекции в стиле Фибоначчи относительно последней импульсной волны;
- ведёт в реальном времени учёт:
-
- сколько откатов произошло в текущем тренде,
- глубину последнего отката,
- среднюю глубину откатов,
- последний процент коррекции Фибоначчи.
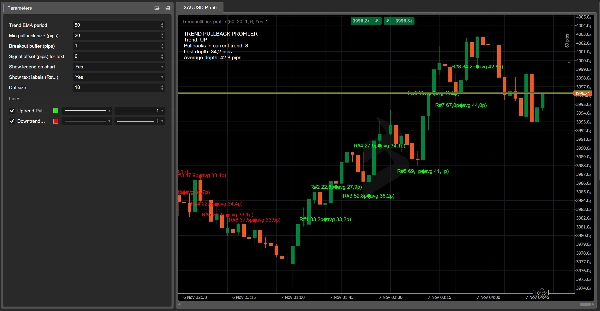
На графике он:
- отмечает большой зелёной точкой минимум отката при восходящем тренде,
- большой красной точкой максимум отката при нисходящем тренде,
- по желанию выводит компактную метку вида:
22.5 p / 38.2%.
В левом верхнем углу динамическая легенда отображает:
- текущее направление тренда (ВВЕРХ / ВНИЗ / НЕТ);
- число откатов в текущем тренде;
- глубину последнего отката (в пунктах);
- среднюю глубину откатов (в пунктах);
- последний процент коррекции Фибоначчи.
Ключевые параметры
- Период EMA для тренда
Период EMA, используемый для определения направления тренда. - Минимальный размер отката (пункты)
Минимальная необходимая глубина отката (в пунктах) для учёта его как валидной коррекции. - Буфер пробоя (пункты)
Дополнительное расстояние, на которое цена должна выйти за предыдущий экстремум тренда, чтобы подтвердить новую волну и закрыть откат. - Смещение сигнала (пункты) для текста
Вертикальное смещение текстовых меток относительно максимума/минимума отката. - Показывать легенду на графике
Включает или отключает легенду на графике с информацией о тренде, последнем и среднем значениях. - Показывать текстовые метки рядом с точками
Если включено, выводит небольшую метку рядом с точкой с глубиной отката (и опционально процентом Фибоначчи). - Показывать % Фибоначчи в метках
Если включено, в метке отображаются и пункты, и процент Фибоначчи (XX.Xp / YY.Y%). - Размер точки
Управляет размером точек на графике, делая откаты легко заметными даже на младших таймфреймах.
Практические случаи использования
- Визуальный профиль глубины откатов для заданного символа/таймфрейма.
- Планирование лимитных входов вокруг типичных зон коррекции вместо случайных уровней.
- Выявление необычно глубоких откатов (например, за пределами 61.8% или 78.6%), которые могут сигнализировать о истощении тренда или возможном развороте.
- Добавление объективной, числовой информации об откатах и коррекции Фибоначчи в вашу торговую стратегию по тренду.
Как рассчитывается коррекция Фибоначчи в Trend Pullback Profiler
Trend Pullback Profiler вычисляет процент коррекции в стиле Фибоначчи на основе последней импульсной волны тренда, а не на произвольных максимумах и минимумах.
При восходящем тренде
- Индикатор отслеживает импульсную волну от:
-
- Базовой цены тренда = последний значимый минимум (конец предыдущего отката)
- Экстремума тренда = последний максимум колебания тренда
- Когда формируется откат, индикатор измеряет:
-
- Глубину отката (цена):
depthPrice = trendHigh – pullbackLow - Размер импульсной волны:
legSize = trendHigh – trendBasePrice
- Глубину отката (цена):
- Процент коррекции Фибоначчи вычисляется по формуле:
Fib% = (depthPrice / legSize) * 100
Таким образом, если цена откатывается примерно на 38.2%–50% от последнего импульса перед продолжением роста, вы увидите значения, близкие к 38.2%, 50%, 61.8% и т.д.
При нисходящем тренде
- Импульсная волна идёт от:
-
- Базовой цены тренда = последний значимый максимум (конец предыдущего отката)
- Экстремума тренда = последний минимум колебания тренда
- Откат идёт вверх против тренда, и индикатор измеряет:
-
- Глубину отката (цена):
depthPrice = pullbackHigh – trendLow - Размер импульсной волны:
legSize = trendBasePrice – trendLow
- Глубину отката (цена):
- Та же формула:
Fib% = (depthPrice / legSize) * 100
Таким образом, каждая точка на графике представляет откат внутри явного импульса текущего тренда, выраженный как в пунктах, так и в процентах Фибоначчи, что позволяет быстро оценить, является ли коррекция неглубокой, типичной или необычно глубокой.
Сводка
Key features include:
- Detection of trend direction and pullbacks.
- Measurement of pullback depth and Fibonacci retracement percentage.
- Live tracking of the number of pullbacks, last pullback depth, average pullback depth, and last Fibonacci retracement percentage.
- Visual chart elements such as large green dots at pullback lows in uptrends and large red dots at pullback highs in downtrends.
- Optional compact labels displaying pullback depth and Fibonacci percentage.
- A dynamic legend showing current trend direction, pullback counts, and metrics.
The Fibonacci retracement is calculated based on the last impulse leg, defined by the last significant trend base and extreme prices, providing objective numeric data to assess whether retracements are shallow, typical, or unusually deep. The indicator supports various markets including Forex, indices, commodities, cryptocurrencies, and stocks. It offers configurable parameters such as EMA period, minimum pullback size, breakout buffer, and display options for labels and legend.
Отзывы покупателей
5 | 50 % | |
4 | 50 % | |
3 | 0 % | |
2 | 0 % | |
1 | 0 % |


