AbsorptionRatio_AutoRiskPanel
Indicateur
Version 1.0, Dec 2025
Windows, Mac
5.0
Avis : 1
Description
AbsorptionRatio_AutoRiskPanel transforme n'importe quel symbole cTrader en un tableau de bord de régime de risque en temps réel 🛰️.
Au lieu de s'appuyer sur plusieurs ETF comme le Ratio d'Absorption multi-actifs original, cet indicateur construit un proxy AR à symbole unique directement à partir de l'action des prix de l'instrument que vous tradez :
- 📉 Il calcule les retours logarithmiques du symbole actuel.
- 🔗 Il mesure l'autocorrélation des retours sur plusieurs décalages (1…7 barres, selon la période de corrélation).
- 📊 Il agrège la moyenne absolue de l'autocorrélation et la mappe dans un Ratio d'Absorption normalisé entre 0,5 et 1,0 — des valeurs plus élevées signifient une concentration plus importante et un comportement plus resserré.
- 🧬 Il lisse le signal brut avec une EMA, produisant une courbe AR stable.
- 🧪 Sur une fenêtre statistique glissante, il calcule :
-
- la moyenne et l'écart-type de l'AR
- le Z-Score actuel (combien de σ au-dessus/en dessous de la moyenne)
- le rang percentile de l'AR d'aujourd'hui par rapport à l'historique
- 🤖 Avec les Seuils Automatiques activés, l'indicateur auto-calibre continuellement les niveaux de risque :
-
- Risque Faible ≈
moyenne − 0,5σ - Risque Élevé ≈
moyenne + 0,5σ - Risque Extrême ≈
moyenne + 1,5σ
Les valeurs sont limitées à[0…1]et mises à jour barre par barre, de sorte que les régimes s'adaptent à chaque symbole et intervalle de temps.
- Risque Faible ≈
- 🧱 À partir de ces seuils, AbsorptionRatio_AutoRiskPanel définit quatre régimes dynamiques :
-
- FAIBLE → environnement dispersé, détendu / risque pris
- NORMAL → conditions équilibrées / neutres
- ÉLEVÉ → regroupement accru, tendances à éviter le risque
- EXTRÊME → environnement stressé, pic potentiel de risque systémique 🛑
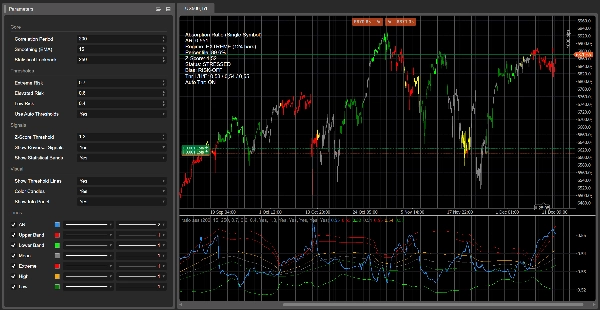
- 🕯️ Sur le graphique principal, les chandeliers peuvent être codés par couleur selon le risque :
Cela vous donne un filtre visuel immédiat : par exemple, ne trader les entrées de tendance que lorsque les chandeliers ne sont pas rouges/oranges, ou réduire la taille pendant les régimes stressés. -
- 🔴 Rouge → AR statistiquement stressé (Z-Score ≥ seuil)
- 🟢 Citron vert → AR statistiquement calme (Z-Score ≤ −seuil)
- 🟧 / 🟡 Orange/Jaune → au-dessus de Élevé / proche d'Extrême
- ⚪ Gris → zone neutre
- 💚 Vert → AR faible, comportement plus dispersé / prise de risque
- 🎯 Signaux optionnels de retournement vers la moyenne dans le panneau AR :
-
- 🟢 Flèche d'achat lorsque l'AR est statistiquement calme et commence à remonter
- 🔴 Flèche de vente lorsque l'AR est statistiquement stressé et commence à redescendre
- 📋 Un panneau d'information compact dans le coin supérieur gauche affiche :
-
- valeur actuelle de l'AR
- Régime actif + durée (barres passées dans ce régime)
- Percentile, Z-Score et Statut qualitatif (STRESSÉ / CALME / NORMAL)
- Biais de risque (PRISE DE RISQUE / ÉVITEMENT DU RISQUE / NEUTRE)
- les seuils effectifs Faible / Élevé / Extrême utilisés et si les Seuils Automatiques sont activés ou désactivés
Utilisez AbsorptionRatio_AutoRiskPanel pour :
- éviter de trader pendant des régimes statistiquement stressés et sans risque
- identifier des environnements calmes où les cassures ou le suivi de tendance peuvent mieux fonctionner
- contextualiser toute stratégie dans un cadre dynamique de régime de risque plutôt que d'utiliser des filtres de volatilité fixes.
⚙️ Paramètres (docs de stockage)
Noyau ⚙️
- Période de Corrélation – Durée de la fenêtre d'autocorrélation. Contrôle la quantité d'historique utilisée pour estimer le Ratio d'Absorption. Des valeurs plus grandes = régime plus lisse, plus « macro » ; des valeurs plus petites = plus rapide mais plus bruyant.
- Lissage (EMA) – Période EMA appliquée au signal AR brut. Des valeurs plus élevées lissent les changements de régime, des valeurs plus basses rendent l'indicateur plus réactif.
- Fenêtre Statistique – Période de retour en arrière pour la moyenne AR, l'écart-type, le Z-Score et le percentile. Détermine la rapidité d'adaptation de la base statistique.
Seuils 🚦
- Risque Extrême / Risque Élevé / Risque Faible – Seuils manuels pour les régimes AR (FAIBLE / NORMAL / ÉLEVÉ / EXTRÊME) utilisés lorsque les Seuils Automatiques sont désactivés. Lorsqu'ils sont activés, ils sont ignorés pour la logique et visibles uniquement comme valeurs par défaut.
- Utiliser les Seuils Automatiques – Lorsqu'activé, les seuils sont dérivés des statistiques AR glissantes :
-
- Risque Faible = moyenne − 0,5σ
- Risque Élevé = moyenne + 0,5σ
- Risque Extrême = moyenne + 1,5σ
Signaux 🎯
- Seuil de Z-Score – Z-Score absolu minimum pour classer l'AR comme statistiquement extrême. Détermine les étiquettes STRESSÉ/CALME, les surcharges de chandeliers et les flèches de retournement vers la moyenne.
- Afficher les Signaux de Renversement – Active/désactive les flèches ACHAT/VENTE dans la sous-fenêtre AR.
- Afficher les Bandes Statistiques – Bascule les bandes ±2σ et la ligne moyenne autour de l'AR.
Visuel 🎨
- Afficher les Lignes de Seuil – Affiche les niveaux effectifs Faible / Élevé / Extrême utilisés par le moteur de régime (manuel ou automatique).
- Colorer les Chandeliers – Colore les chandeliers de prix selon le Z-Score et le niveau de régime pour une visualisation instantanée du risque.
- Afficher le Panneau d'Info – Affiche le panneau de texte dans le coin supérieur gauche avec AR, régime, statistiques et biais.
Résumé
Profil de l'indicateur
Avis clients
5.0
Avis : 1
5 | 100 % | |
4 | 0 % | |
3 | 0 % | |
2 | 0 % | |
1 | 0 % |
Avis clients
December 20, 2025
the cleanest use is it makes weak ideas easier to leave alone, and It should stay in the support stack.
Discussion
Questions fréquentes
Signal
Indices
Commodities
GBPUSD
RSI
Bollinger
Fibonacci
Scalping
AI
XAUUSD
NAS100
MACD
BTCUSD
Forex
Breakout
EURUSD
NZDUSD
Martingale
Prop
ZigZag
Supertrend
Fair Value Gap
SMC
Crypto
Grid
Stocks
ATR
USDJPY
VWAP
Les produits disponibles sur cTrader Store, notamment les bots de trading, les indicateurs et les plug-ins, sont fournis par des développeurs tiers et mis à disposition à titre informatif et à des fins d'accès technique uniquement. cTrader Store n'est pas un courtier et ne fournit aucun conseil en investissement, aucune recommandation personnelle ni aucune garantie quant aux performances futures.


Prix
42.11M
Volume tradé
6.13M
Pips gagnés
224
Ventes
8.42K
Installations gratuites