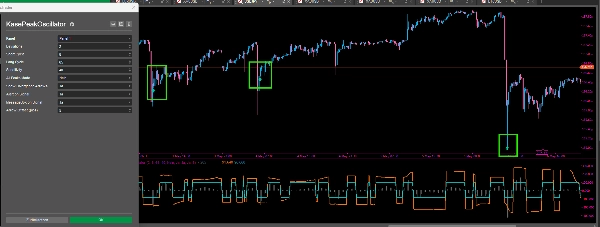
Descrizione
Il KasePeakOscillator (KPO) è uno strumento sofisticato di analisi tecnica progettato per identificare l'esaurimento del mercato, i ribaltamenti di tendenza e i cambiamenti di momentum. A differenza degli oscillatori standard, il KPO integra misure statistiche di volatilità per fornire segnali più affidabili in condizioni di mercato variabili.
Come funziona: L'indicatore calcola la relazione tra l'azione del prezzo e la volatilità storica (Range Medio Giornaliero/Deviazione Standard). Valuta i "Cicli Brevi" rispetto ai "Cicli Lunghi" per determinare se un movimento di prezzo è statisticamente significativo o semplicemente rumore di mercato. Il risultato è un oscillatore fluido e reattivo che oscilla attorno a una linea zero.
Componenti chiave:
- L'Istogramma (KCD): Rappresenta il nucleo del momentum. Un attraversamento della linea zero indica un cambiamento nel bias della tendenza a breve termine.
- Bande Dinamiche (Superiore/Media): Queste fungono da soglie statistiche di "ipercomprato" e "ipervenduto". Si adattano alla volatilità del mercato, espandendosi durante periodi di alta attività e contraendosi durante la consolidazione.
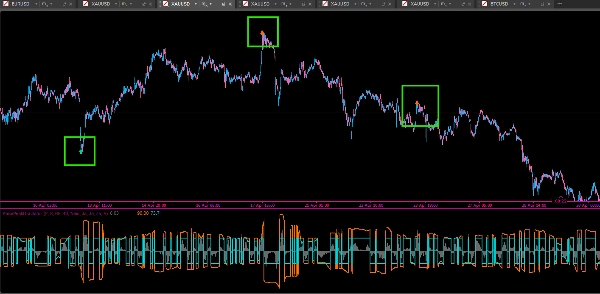
- Rilevamento Automatico dei Picchi: L'indicatore identifica "Picchi" e "Minimi" dove il momentum raggiunge un estremo statistico, segnalando un potenziale esaurimento.
Strategia di Trading:
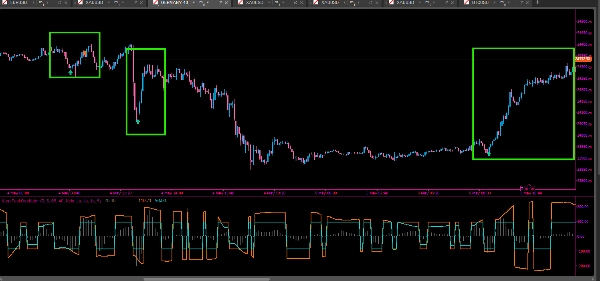
- Esaurimento del Picco: Quando un picco di momentum si verifica al di fuori delle bande dinamiche (indicato da frecce Menta o Arancioni), suggerisce che la tendenza attuale è sovraestesa e una inversione o correzione è probabile.
- Segnali di Divergenza: Il KPO identifica automaticamente Divergenze Rialziste e Ribassiste. Una divergenza si verifica quando il prezzo fa un nuovo estremo ma l'oscillatore non lo fa, indicando un indebolimento del momentum. Queste sono contrassegnate con Azzurro Chiaro (Rialzista) e Oro (Ribassista) icone.
- Conferma della Tendenza: Usa la posizione dell'Istogramma rispetto alla linea zero per confermare la direzione della tendenza. Rimanere sopra lo zero supporta posizioni long, mentre rimanere sotto lo zero supporta posizioni short.
Caratteristiche:
- Sistema di Allerta Integrato (Suono, Finestra di Messaggio e Icone Visive).
- Sensibilità Regolabile per adattarsi a diverse classi di asset (Forex, Indici, Cripto).
- "Modalità Tutti i Picchi" per scalping aggressivo o modalità filtrata per setup swing ad alta probabilità.
Riepilogo
Key components include:
- Histogram (KCD): Represents core momentum; zero-line crossings indicate short-term trend changes.
- Dynamic Bands: Volatility-adjusted thresholds signaling overbought or oversold conditions.
- Automated Peak Detection: Identifies momentum extremes signaling potential trend exhaustion.
The KPO provides automated alerts for peak exhaustion and divergence signals, marking bullish and bearish divergences when price and momentum disagree. Trend direction can be confirmed by the histogram’s position relative to zero.
Features include adjustable sensitivity for various asset classes such as Forex, indices, and cryptocurrencies, an integrated alert system (sound, message, visual icons), and modes tailored for scalping or swing trading. The indicator supports analysis based on price bars and outputs reversal and divergence signals to assist in trading decisions.
Recensioni dei clienti
5 | 100 % | |
4 | 0 % | |
3 | 0 % | |
2 | 0 % | |
1 | 0 % |