
Beschreibung
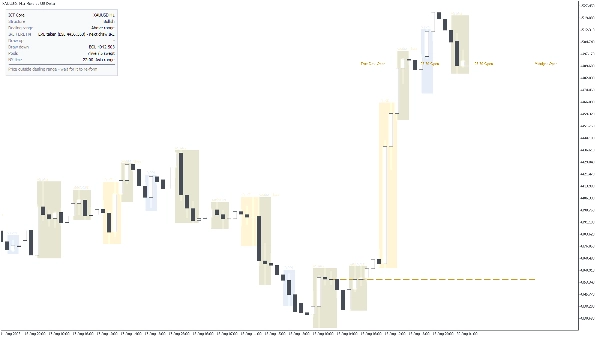
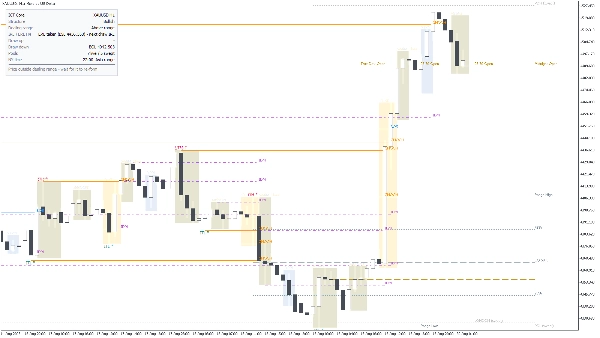
ICT Core verwandelt ein rohes Preischart in eine strukturierte Smart Money Concepts (ICT) Darstellung: Marktstruktur, Liquiditätspools, die Handelsspanne, IRL / ERL Zustand, New York Sessions und Killzones sowie ein Panel, das die aktuelle Tendenz und den bedingten Plan in klarem Englisch angibt. Es zieht nur aus abgeschlossener, bestätigter Kursbewegung – sobald ein Level oder Label gedruckt ist, bleibt es dort.
WAS ES ANALYSIERT
ICT Core liest Balkendaten (Open / High / Low / Close) vom Chart-Symbol sowie einen höheren Zeitrahmen Ihrer Wahl (Standard H4) für die IRL / ERL-Auswertung. ATR wird verwendet, um die Schwankungsgröße, den Abstand der Labels und die Toleranz für Gleichhochs / Gleichtiefs zu skalieren, sodass dieselben Einstellungen auf XAUUSD, Indizes und FX konsistent funktionieren. Session- und Killzone-Zeiten werden in New Yorker Zeit mit automatischer DST-Handhabung berechnet, nicht in festen Brokerzeiten.
WAS ES ZEICHNET UND WIE MAN ES LIEST
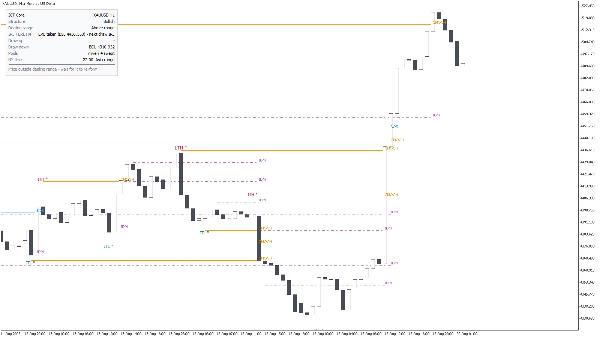
- Marktstruktur. Swings werden als kurzfristig, mittelfristig und langfristig klassifiziert. Brüche werden als BOS (Fortsetzung) oder CHOCH (Charakterwechsel) bezeichnet; ein Bruch, der nur durch den Docht erfolgt, wird separat als Sweep markiert, sodass Sie eine echte Verschiebung von einem Überfall unterscheiden können. Hochs und Tiefs, die durch ein impulsives Bein genommen wurden, werden als stark / schwach markiert.
- Inducement (IDM). Das kleinere Hoch oder Tief, das der Preis wahrscheinlich vor der eigentlichen Bewegung durchläuft, wird markiert, sodass Sie die Falle sehen können, bevor sie zuschnappt.
- Liquiditätspools. Vorheriger Tag, vorherige Woche, vorheriger Monat, Session-Hochs und -Tiefs sowie Gleichhochs / Gleichtiefs werden als Kaufseite (BSL) und Verkaufsseite (SSL) Levels gezeichnet. Sobald ein Pool gesweept wurde, wird er abgedunkelt statt gelöscht, sodass die Historie dessen, was bereits genommen wurde, lesbar bleibt.
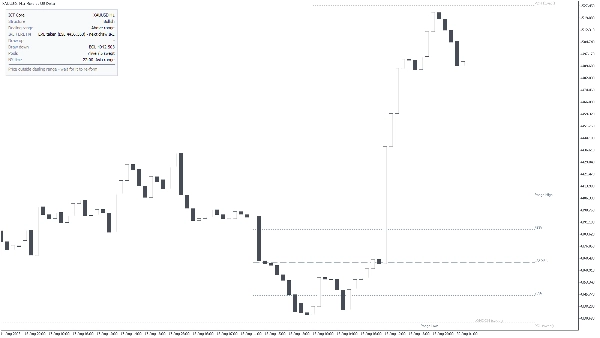
- Handelsspanne. Die aktive Spanne zwischen dem letzten gültigen Hoch und Tief, mit optionalen 25% / 75% Quadranten als Referenz für Premium / Discount.
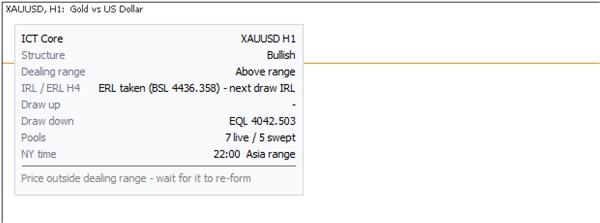
- IRL / ERL. Das Panel gibt an, ob externe Liquidität genommen wurde und die nächste Bewegung intern ist oder umgekehrt, basierend auf dem von Ihnen gewählten höheren Zeitrahmen.
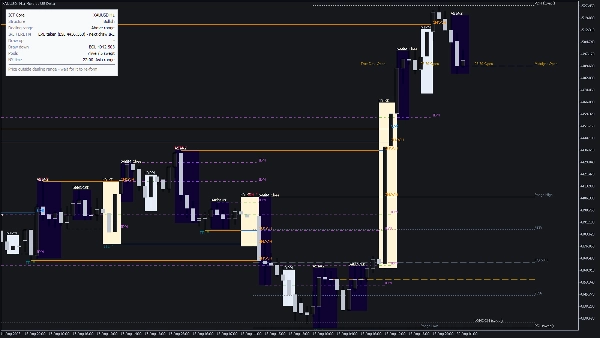
- Sessions und Zeit. Asia, London, NY AM und NY PM Boxen; London, New York und London-Close Killzones; Silberkugel-Fenster; optionale 20-Minuten-Makros; und Linien für Session-Eröffnungspreise.
- Info-Panel. Symbol und Zeitrahmen, Struktur-Tendenz, wo der Preis in der Handelsspanne liegt, IRL / ERL Zustand, die nächstgelegene Bewegung ober- und unterhalb mit deren Preis, wie viele Pools aktiv versus gesweept sind, New Yorker Zeit und die aktive Session – plus eine bedingte Planzeile wie „Preis außerhalb der Handelsspanne – warten, bis sie sich neu bildet“.
- Alarme. Popup, Ton oder E-Mail bei Pool-Sweep, bei BOS / CHOCH und beim Öffnen der Killzone.
WICHTIGE EINSTELLUNGEN
- Allgemein: Chart-Thema (auto / hell / dunkel), zu analysierende Balken (Standard 1500), Schriftgröße der Labels und wie weit Labels versetzt sind (in ATR).
- Marktstruktur: Swing-Stärke in Balken auf jeder Seite (Standard 2), welche Swing-Ebenen angezeigt werden, BOS / CHOCH an oder aus, Docht-only Brüche an oder aus, Inducement an oder aus, und die Impulsgröße in ATR, die ein Hoch oder Tief als stark qualifiziert (Standard 1.0).
- Liquiditätspools: welche Pools gezeichnet werden, Gleichhoch / Gleichtief Toleranz in ATR (Standard 0.15), wie viele Tage ein Pool gültig ist (Standard 20), und ob gesweepte Pools sichtbar bleiben.
- Handelsspanne: Spanne an oder aus, 25% / 75% Quadranten an oder aus.
- IRL / ERL: Quellzeitrahmen (Standard H4) und wie viele Balken davon gescannt werden (Standard 300).
- Sessions: Session-Boxen, Killzones, Silberkugel, Makros, Eröffnungspreise, wie viele Tage zurück gezeichnet wird (Standard 5), und Box-Füll-Opazität.
- Panel: Ecke, X / Y-Versatz, Schriftgröße, ob die Planzeile angezeigt wird, wie viele Balken ein Sweep noch als aktuell zählt (Standard 12), und ob der Plan eine aktive Killzone erfordert.
- Alarme und ein vollständiges Farbschema für jedes Element im Chart.
TYPISCHE ANWENDUNG
1. Fügen Sie ICT Core einem M5 - H1 Chart von XAUUSD, einem Index oder einem wichtigen FX-Paar hinzu.
2. Lesen Sie das Panel von oben nach unten: Tendenz, Position in der Handelsspanne, IRL / ERL und die nächstgelegene Bewegung ober- und unterhalb.
3. Warten Sie, bis ein Liquiditätspool innerhalb einer Killzone gesweept wird, und suchen Sie dann auf Ihrem Einstiegszeitrahmen nach CHOCH gegen den Sweep.
4. Verwenden Sie die im Panel angezeigte entgegengesetzte Bewegung als Ziel und das gesweepte Extrem als Ungültigkeitsbereich.
5. Schalten Sie Sweep- und BOS / CHOCH-Alarme ein, wenn Sie den Chart nicht die ganze Session beobachten möchten.
FÜR WEN ES GEEIGNET IST
Trader, die bereits mit ICT / Smart Money Concepts arbeiten und die Struktur-, Liquiditäts- und Timing-Ebenen auf einem Chart statt täglich von Hand gezeichnet haben möchten. Es richtet sich an Intraday- und kurzfristige Swing-Trader mit diskretionärem Ansatz. Es ist kein Anfänger-Werkzeug mit Kauf-/Verkaufspfeilen – Sie müssen wissen, was BOS, CHOCH, IDM, IRL und ERL bedeuten, um es zu nutzen.
WICHTIGE EINSCHRÄNKUNGEN UND HINWEISE ZUR NUTZUNG
- ICT Core ist ein Analyse- und Visualisierungstool. Es platziert keine Orders, gibt keine Kauf-/Verkaufssignale und die Planzeile ist eine bedingte Erinnerung, keine Empfehlung.
- Alles basiert auf bestätigten Swings, daher erscheint ein Strukturpunkt erst, nachdem die erforderliche Anzahl von Balken auf jeder Seite geschlossen ist (Standard 2). Es wird danach nichts neu gezeichnet.
- Session- und Killzone-Zeiten folgen der New Yorker Zeit inklusive DST. Ihr Chart wird in Broker-Serverzeit angezeigt, daher stimmen die Boxen nicht mit einem festen UTC-Offset überein – das ist beabsichtigt.
- Die IRL / ERL-Auswertung im höheren Zeitrahmen benötigt genügend Historie in diesem Zeitrahmen; bei Symbolen mit kurzer Historie wird sie als nicht verfügbar angezeigt.
- Die Analyse ist auf das Fenster der zu analysierenden Balken beschränkt (Standard 1500). Erhöhen Sie es für mehr Historie, auf Kosten eines längeren ersten Zeichnens.
- Läuft auf cTrader Desktop für Windows und Mac. Benutzerdefinierte Indikatoren sind auf Mobilgeräten oder im Web nicht verfügbar.
- Trading beinhaltet Risiken. Vergangenes Verhalten eines Musters garantiert keine zukünftigen Ergebnisse. Verwenden Sie stets Ihr eigenes Risikomanagement.
Zusammenfassung
ICT Core highlights liquidity pools from previous days, weeks, months, and sessions, showing buy-side and sell-side levels, and dims swept pools to maintain historical context. It also delineates session times and killzones based on New York time with automatic daylight saving adjustments. An info panel provides a summary of current bias, price position within the dealing range, IRL/ERL status, nearest levels, live versus swept pools, and a conditional trading plan in plain English.
Users can customize settings including chart theme, swing parameters, liquidity pool visibility, session displays, and alert notifications for pool sweeps, BOS/CHOCH events, and killzone openings. ICT Core is intended for traders familiar with ICT/SMC concepts seeking an integrated, structured view of market dynamics for intraday and short-swing discretionary trading.

















